Taking An Active Interest Australian ASX-200- Part 2
Let’s look at Part 2 of Taking an Active Interest. Following on from last week’s article about active investing using the S&P 500 Index ETF, let’s now apply the same strategy to the Australian ASX-200 ETF (STW).
The rules are:
- Buy the [Index] STW ETF
2. Sell to cash if the price falls below the simple 10-month moving average
3. Buy back when it crosses back above againThis ETF was listed in late 2001 so we’ll track performance from January 1st 2002.
Here’s the metrics (vs buy and hold):
CAGR: +8.8% (+7.8%)
Exposure: 71% (100%)
# Trades: 9 (1)
Win%: 67% (100%)
W/L Ratio: 3.37 (n/a)
The equity curve looks like this…
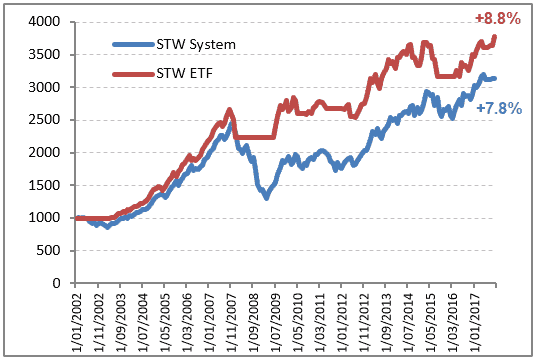
The equity curve is not as appealing to that of the US ETF we reviewed last week, but we’re still seeing better performance than Buy & Hold.
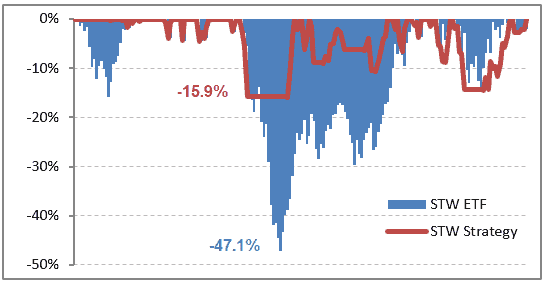
And here’s the most important chart – the pain chart.
Two things stand out here.
The obvious is the level of pain, or drawdown, is significantly lower taking the active route; -15.9% vs -47.1%.
Secondly, the time to recover from that equity decline is significantly faster using an active approach. The Buy & Hold strategy recovered its GFC losses by November 2013 (71 months) whereas the active strategy was making new equity highs by November 2009 (22 months).
In summary this is a very simple strategy that outperforms Buy & Hold yet also reduces the pain and anxiety associated with sustained bear markets.
That’s a win/win right there.
For the very vast majority of investors wanting to take control of their own assets yet are time poor, then a strategy such as this is ideal.
But it’s not for me.
Next article I’ll explain why.
P.S – Another strategy that actively uses ETFs is discussed here.
![]()