Share Trading Videos: Understanding Your Equity Curve
In this share trading video Nick Radge discusses how to understand your equity curve and what to expect during the trading journey.
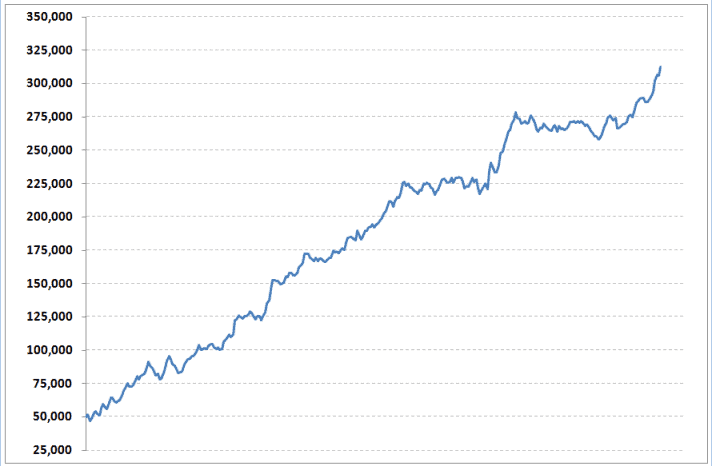
Nick shows you a real equity curve for the Growth Portfolio (the image above is an example only). It appears to be a nice, smooth upward journey.
However within the upward journey are days and weeks of downturns and bumpy rides.
The rough journey is simply a part of the bigger journey.
Often you see the glossy ads in the paper showing a beautiful equity curve. There’s a great ad that appears in Stocks and Commodities magazine in the US. They always advertise a system with a ripper equity curve and of course it just gets everyone in but they’re showing you several thousand trades.
What they don’t show you is what can happen in the short term.
I often talk about the journey driving from Sydney to Brisbane; the short term downturns are your traffic jams. Your sitting in traffic -13 losing trades in a row.
So if I show everyone a beautiful upward equity curve you’ll all want a piece of that. Then when there’s a string of losses, all of a sudden things go a little pear shaped.
I call this the Beginners Cycle.
I had a lady come to me having spent $19,000 on software and seminars. She has been trading for six years and was still a losing trader. I suggested that she had probably come across a positive expectancy system right at the start but hasn’t stuck with it, hasn’t allowed it to make its money.
She may have started with three or four losing trades in a row. That’s all it takes for a beginner to stop trading and look for something else. They go around and around and around.
But if you understand expectancy and why your strategy or system makes money, this will be less of an issue for you.