Strategies that will continue to profit
Are you keen to gain some knowledge on strategies that will continue to profit?
In last week’s article we discussed why some strategies are prone to failure in the future. You can read that article HERE.
So, what does robustness look like? What measures can we take to gain confidence that our strategy will continue to work into the future?
There are a few basic rules and there are some more technical ‘stress-testing’ procedures that should be followed.
For the purposes of this article we’ll use the Weekend Trend Trader (WTT) strategy as an example. It was released in 2012 and I continue to use a variant today, as do many traders around the world.
The basic rules of robustness are:
Minimal Parameters
The WTT has one regime filter parameter, two entry parameters and two exit parameters. There are not a lot of working parts and as such not much can go wrong. Compare that to systems that have many moving parts, such as multiple indicators combined with bar patterns for entries and exits which also incorporate a different set of indicators and bar patterns. Some systems can have 15 – 20 different parameters.
The Strategy Edge is Explainable
The WTT is a long-only absolute trend following strategy. It will make money when equities are trending higher, lose money in sideways markets and remain in cash in sustained bear markets. One should be able to compare periods of market activity and the performance of the WTT.
Compare that to a strategy that will buy US T-Bonds only if the S&P 500 is down 3 days in a row, today is Thursday and the month is not March, June, or October. Makes no sense and one would be unable to explain why the strategy is not working in any given market environment.
Should work ‘reasonably well’ across a broad universe of symbols
We touched on this last week with single market systems. Basically, if the personality of a symbol changes, then so will the outcome. But if a strategy, such as the WTT, is applied to a large universe of stocks using the same rules for each, then we’re already dealing with hundreds of different personalities yet still getting profitable results. Personally, I trade the WTT on 3790 different stocks – all of which adhere to the same system rules.
So, here are a few more technical stress-testing exercises that can then be done. If, after these exercises, the strategy continues to show reasonable profitability, then chances are we’re onto something that will work into the future.
Monte Carlo Simulations (trade skip or bootstrap)
When trading a large universe of stocks, some strategies will generate more signals than capital available. If faced with making a choice between two signals, we introduce Selection Bias. We can overcome this by ranking the signals, or running Monte Carlo Simulation to resample the signals taken to create different outcomes.
Increase Signal Variance
Even though our system rules are static, they need to flex enough to absorb slight changes in the market environment. One way to add some randomness, and therefore test flex, is to add some minor variability to the system rules. For example, let’s say our system uses a 100-day breakout, we can ask the computer to adjust that by +/-5% randomly on any given day. That would provide a different outcome from our initial static tests.
Increase Data Variance
Data ‘peaking’ is where we invariably build a system based on prior knowledge of what the market has done in the past. Some argue that once you’ve looked at the data, then all testing from that point on is prone to data mining. Whilst the future is never exactly the same as the past, we can randomly change the past data to resample for a different outcome. For example, the WTT uses the closing price each week to determine an entry/exit for the following open. We can ask the computer to randomise the close by +/-5% or even randomise the Monday open by +/-5%. As such the past data is now slightly different to what the original system was built around.
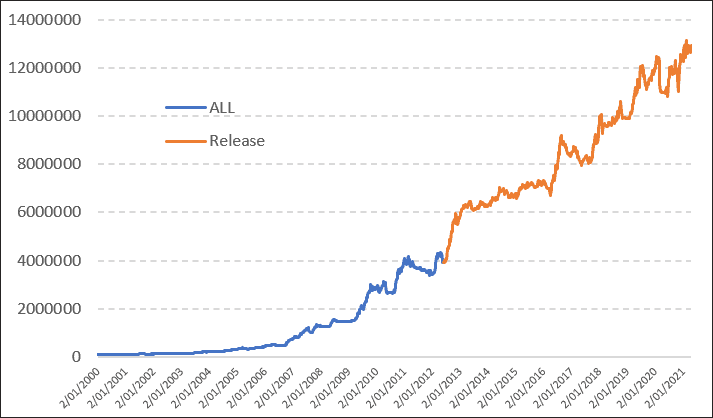
The WTT, released in 2012, was designed to trade the Russell-3000 universe and adheres to all the above robustness elements.
So how does it look now, with 8 or so years of out-of-sample data?
The blue line shows in-sample testing from 2000 through to release in 2012.The orange line is the out-of-sample from release through to today. Not bad.
But here’s the game-changer.
The equity curve shown above is not the WTT being tested on the Russell-3000. It’s the exact same rules and parameter settings, yet tested on the full ASX market.
If that’s not a sign of robustness, I’m not sure what is.
![]()