
What Value Are Charts?
Doug B. sent the following tweet from Peter Brandt, a highly respected commodities trader who has built his career on trading classical chart patterns. I have followed Peter for many years and have previously asked him to speak at Noosapalooza®.
Here’s the comment…
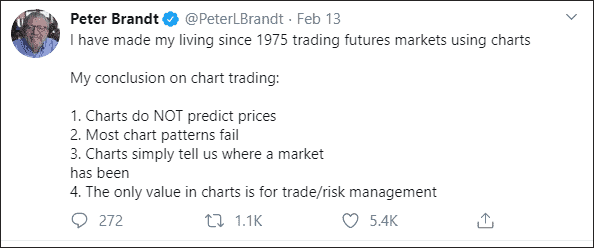
I wholeheartedly agree with the comment.
Those of you who’ve known me long enough know I advocate creating a positive expectancy by riding winners and cutting losses. You can have a very profitable edge with a low win rate, i.e. < 50%. It could be argued that a setup with a lower than 50% win rate is not predictive.
However, this is not what Doug B. was alluding to. He goes on to say…
“ …if charts have no predictive value (which I’m not disputing), why do [The Chartist analysts] use charts to set entries and exits? If charts truly have no predictive power, shouldn’t our entries be random? Obviously our exits shouldn’t be random, but should be unaffected by chart patterns.
Similarly, do you consider your systematic strategies as TA?“
The answer to the first question is:
(a) we need structure or a reason to enter and exit the market,
(b) that reason needs to be repeatable, and
(c) we need to feel comfortable.
(a) and (b) go hand in hand.
Without comfort we probably wouldn’t be able to participate. We feel comfortable with charts because they provide a foundation from which to enter, place a stop, calculate position size, manage risk and create the required positive expectancy.
That can’t be done using a random process. And I would argue that entering at a random point with a fixed stop or exit isn’t a random process. A true “random process” is where one has no preconceived idea of where to enter or exit and therefore no way to correctly size a position which in turn wouldn’t create a positive expectancy.
Charts, even having random outcomes, allow us to create a positive expectancy.
As an example, we monitored 9 short term chart patterns over 447 occurrences. Of these 9 patterns, the winning percentage of trades was 35% and 3 of the 9 patterns were net losers.
The worst pattern was a Symmetrical Triangle that generated a ROI of -11% and a win rate of just 23.9%. The best was a Resistance Breakout with a ROI of +17.8% and a win rate of 40.8%. The highest win rate was a Base Breakout at 61.5% but with a ROI of +8.3%.
Of the total 447 occurrences, the ROI was +40.1% and a maxDD of -18.8%.
In summary, to answer query #1, it’s about comfort in applying a process consistently whilst creating a positive expectancy.
For the second question, “…do you consider your systematic strategies as TA?”
Our trading systems reference price, volatility and other variables, so they would be classed as technical analysis.
But we don’t look at charts.
Depending on the type of system, the positive expectancy either comes from an entry edge (mean reversion) or a money management edge (trend following).
![]()