
What Say You Santa?
Twice a year seasonal influences become the hot topic of conversation across social media; Sell in May and the Santa Claus rally.
Let’s take a look at a few stats on the monthly ups and downs throughout the year and see where December fits in. For this simple test we buy on the first trading day of each month and exit on the first day of the next month. We use All Ordinaries data back to 1980 and S&P 500 data back to 1927.
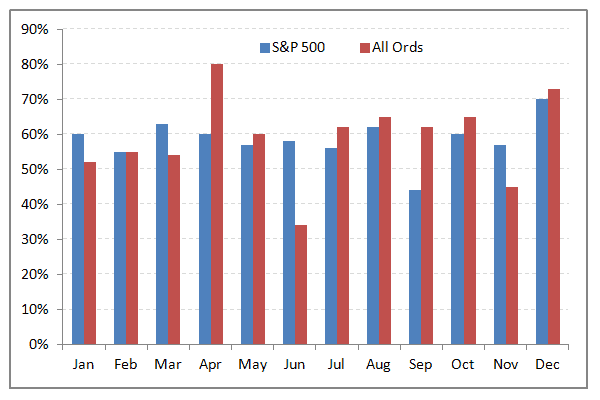
December offers consistent gains of about 70% in both Australia (73%) and the US (70%). April for Australia has been the only better performer.
In Australia the average December gain since 1980 has been +1.92%. The best December was +8.17% in 1993 and the worst was -3.02% in 1990.
In the US, since 1928, the average December gain has been +1.43%. The best December, +11.18%, was 1991 and the worst in 1931 at -16.63%.
I’m not a big fan of seasonal influences such as day of the week, day of the month, first day of the quarter, etc. Usually there is no rational basis for them and usually the supporting data is thin on sample size and the same can be said for the Santa Rally. In years gone past there may have been a reason such as year end window dressing or rebalancing, but this anomaly is not strong enough to rely on in the future.
![]()