
US Stockmarket – Technical Outlook
Global Chart Analyst, Scott Goddard, technical view of the US Stockmarket – Technical Outlook. December 2022.
Bottom Line
Daily Trend: Neutral
Weekly Trend: Up
Monthly Trend: Neutral
Support Levels: 3600 – 3400
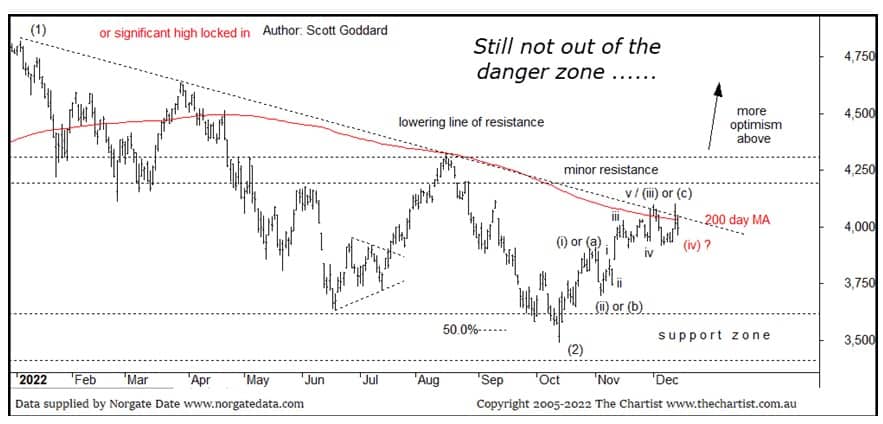
Resistance Levels: 4200-4300/ 4638 / 4819 (all-time highs)
Technical Discussion
We remain near-term bearish until the 4200-4300 resistance level, which is above the current market, can be broken:
→ the longer-term technical outlook remains potentially bullish, however bears remain in control at current prices
→ major support zone at 3600 – 3400 continues to hold
→ there is now a glimmer of hope that aggressive rate hikes may start to slow.
The Federal Reserve hiked interest rates by 50 basis points as expected on Wednesday, with the central bank warning more rises will be necessary to rein in the rapid pace of price increases. The latest forecasts revealed the bank’s key interest rate could stand above 5% a year from now. But policymakers are starting to be more cautious following signs that inflation has started to ease. The target range of the Fed’s benchmark rate is now 4.25% – 4.5% which is the highest level in 15 years
Price continues to be bogged down here around the widely watched 200-day moving average. We did mention in our last review that a minor degree a-b-c flatter type pattern for a possible wave-(iv) would be more than acceptable, and to this point this is exactly what has occurred. The move could still require a further push lower before it completes, but what it’s telling us either way is that a wave-(v) move to the upside could be almost ready to trigger. Good news if this is what plays out as it should see price head into our all-important resistance zone circa 4200-4300.
![]()