
Trend Following – An Effective Strategy for your SMSF?
A recent release from The Industry Super Network (ISN) – the umbrella organization for industry super funds here in Australia, suggests that high embedded fees, including commissions to financial planners, is the main cause for the poor performance of for-profit retail super funds. And, according to Australian Prudential Regulatory Authority (APRA) data, the average return for retail funds over the last 13-years has been 3.6% and 5.5% for industry funds. Is it possible for retail investors to navigate their way around these funds and take control of their direct SMSF equity investments for themselves and in doing so reduce these excessive fees and possibly generate better returns? The answer is emphatically yes.
The ‘how’ comes back to the great article in Your Trading Edge Nov/Dec 2009 with Michael Covel, outlining trend following. We can substitute the term ‘trend following’ with ‘active investing’, that is, anything other than ‘buy and hold’.
In its purest form, as discussed and promoted by Covel, trend following is about participating in all market environments and using more sophisticated instruments to provide non-correlated returns. However, for our purposes we’ll stay with direct equities but ensure we only participate during bullish markets and ensure we revert to cash during bearish markets.
The key to outperforming the market is not being involved when these sustained bearish environments come along. How much would you have paid an advisor who told you to go to cash in late 2007?
The trick with applying this quite obvious strategy is disregarding the common belief that a declining stock price offers a bargain buying opportunity. It will, assuming the stock recovers. But Babcock and Brown didn’t. ABC Learning didn’t. Octaviar. Timbercorp. Great Southern Plantations. Allco Finance. Commander Communications. None of these once revered stocks will give you your money back. This is just the lineup from the most recent price shock. Remember HIH and OneTel?
There is also a very long list of stocks that have not gone bust but still sit so far below their 2007 highs that we can only hope that they’ll recover sometime during our lifetime. These include Stockland, Kagara Zinc, Keycorp, Aristocrat Leisure, Fortescue Metals, Sunland and Alesco. Again, the list goes on.
But every one of these stocks, bust or otherwise, had one trait in common.
They were all trending down for a sustained period of time before they imploded.
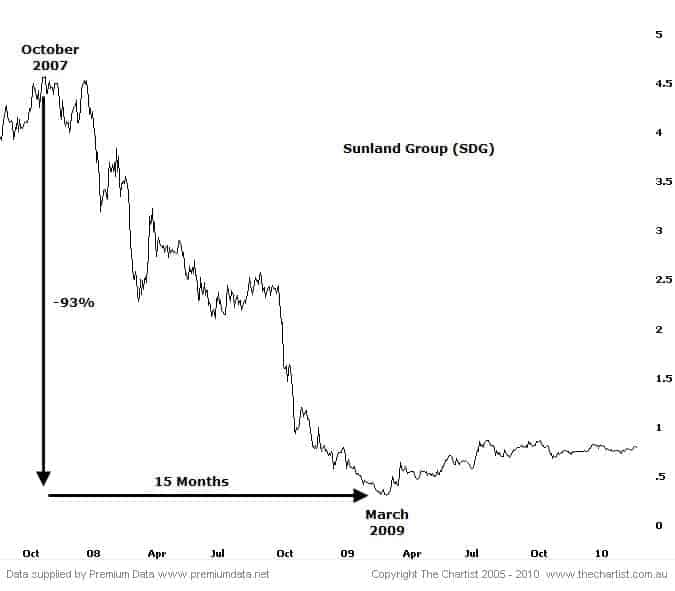
The following chart shows a common example. Sunland didn’t just fall off the face of the earth one morning – it was trending lower for a long time before the bottom was found. For 3-years Timbercorp (TIM) and Great Southern Plantations (GTP) were both trending lower in a sustained fashion before they toppled. There was ample time to take defensive action and exit a position. We can look back in history and see the same nuances with other high profile implosions, such as OneTel and HIH Insurance. Both were in clear down trends for sustained periods of time before they went under.
But the prevailing thinking of ‘getting a bargain ’or‘ getting value’ is probably what made the vast majority ride these types of stocks lower.
When following trends we need to adopt a different thought process and disregard the populist view of ‘buying cheap’. Instead we need to remember that a stock in motion tends to stay in motion, up or down. Additionally we don’t attempt to predict how far a stock will go up or down. We follow. When the stock price starts to rise we jump on board. When it starts falling, we hop off and look for another opportunity.
The analogy I like to use is hitchhiking. Let’s say we wish to hitch-hike from Sydney to Brisbane. The first step is to stand beside the northbound lanes – we’d be in a better position to get a lift to Brisbane than on the south bound side (buy strength). Next, a car pulls over to give us a lift. At this stage we have no idea how far this ride will take us (we’re not predicting). It may take us to Gosford. It may take us to Port Macquarie or it may even take us all the way to Brisbane. What we do know is that we’ll take the lift regardless of how far it will go, but ensure we hop off when the ride finishes (defend the position or take profit when the trend changes). Once the ride finishes we’ll start the process again until we reach our destination or achieve or goals (with investing that’s to protect our capital whilst making some returns).
So what is a simple and effective way to become a hitchhiker in the stock market?
There are many ways to ‘follow the trend’. Some are better than others, but they generally attempt to do the same things. More advanced strategies will tend to have better risk adjusted returns than more vanilla methods but for our purposes here we’ll use a very simplistic strategy known as a breakout.
Entry Criteria: Buy when a stock rises above its yearly high. For our purposes we’ll use 240 trading days. If the stock does not rise above this level then we determine that the trend is still down and that we do not wish to be involved.
Exit Criteria: Exit a stock when it falls back below its 3-month low. We’ll use 60-trading days. Whilst the stock remains above this level we’ll determine that the trend remains up and we will continue to hold the position.
Risk Management: This is an area that could contain a complete article on its own. However, we’ll use a very basic and very conservative approach. We’ll allocate $10,000 per investment and have a maximum number of 10 positions. This means that regardless of account growth we’ll always have a maximum $100,000 invested. Using compounding, i.e. investing a set percentage of the capital to each new position will create a very different result.
Portfolio Management: Because the protection of our capital is of utmost important we should also look at the parts of the markets that tend to impact volatility. As a general rule of thumb, the top ASX-50 stocks show lower volatility, lower growth yet better dividend income. It may be beneficial for a more conservative investor to only focus on these top stocks. A more aggressive investor may wish to venture a little further out, but ideally not past the All Ordinaries Index, or the top 500. For our purposes we’ll stay within the ASX-300 to get a mix of some growth stocks as well as some lower volatility dividend stocks. The following chart is a visual representation of the entry and exit criteria used in this simple system:
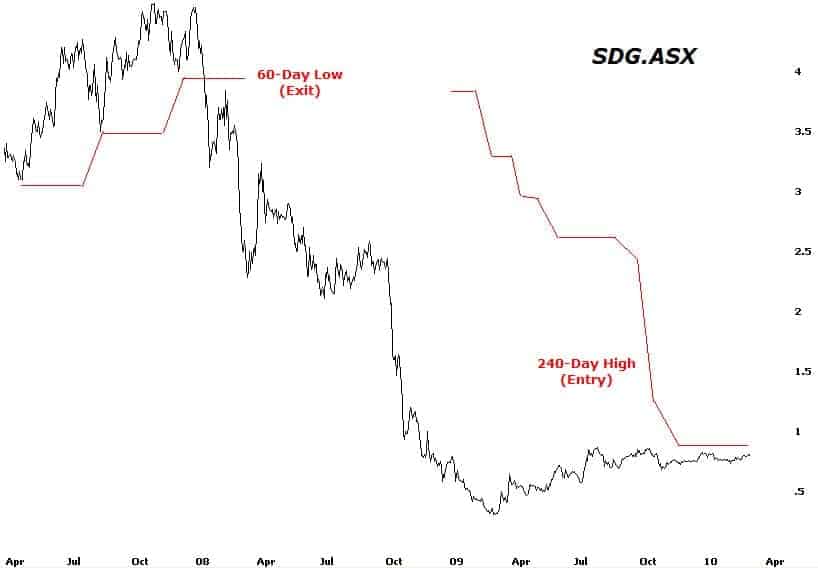
Assuming we held the stock, back in January 2008 the 60-day low was coming under threat signaling an imminent exit. At this stage we would not have known that the stock would completely collapse from $4.00 to sub-$0.50. We can’t possibly know the future but as the stock had started trending lower it was time to exit and take any profit that may have been offered.
Looking at the current 240-day high, our new entry level, we can see the stock is trying to lift its head and move higher. As at writing the buying level has not been attained. If the stock heads south again we won’t be involved. Only if it continues to rise will we hop on board like a hitchhiker catching a ride.
An important point to make here is that we use the same rules on every single stock. We do not attempt to pick the best parameter for each individual stock as this would detract from the long term ‘robustness’ of the strategy. The more you attempt to ‘optimize’ the inputs the less real world it becomes and the higher the chances that it will not work into the future.
Results
In today’s market there is ample software available to enable traders and investors to evaluate their strategies before placing hard earned money into the market. Whilst historical testing is not infallible, it does allow fine tuning of a system.
For this exercise we have used commissions of $12.00 per trade but have excluded dividends and slippage. Because this is a longer term system, slippage is not so important (short term strategies would certainly require a degree of slippage to replicate the real world). Dividends can be considered some extra icing on the cake.
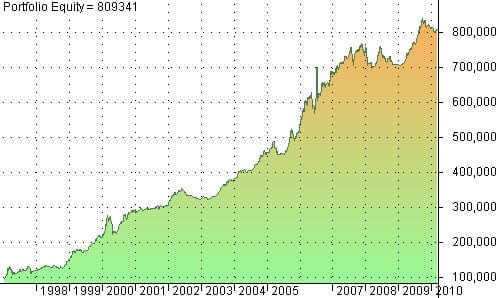
Important Note: Past performance not indicative of future results
Since 1997 the hypothetical $100,000 had turned into about $800,000, an annualized return of just over 17% non-compounded. Not every year will be a winner, indeed the strategy lost 7% during 2008, but compared to the devastation that occurred across the global market place I’m sure many investors would have been happy to employ such a strategy. Another consideration with this graph is that it is based on the current constituent stocks of the ASX-300, which will differ to what made up the index back in 1997. It is impossible to accurately reproduce those constituents however the mathematical expectancy behind the strategy is sound.
The important issue with this ‘trend following’ strategy is that we were able to avoid the major bear markets. Since 1997, when this test was started, there have been numerous price shocks; the Asian Currency crisis, the dot.com crash, September 11, the 2002/03 bear market and the Global Financial Crisis we’re now coming out of. Adopting a more ‘active’ approach that encompasses following trends can offer positive performance yet places the control back firmly into your hands and removes the excessive fees and charges imposed by fund managers. You can follow Nick Radge’s trend trading stategy, the Growth Portfolio, with The Chartist AU or Chartist Pro (AU & US) membership options.
![]()