
‘Tis The Season
It’s about this time of the year we hear about the Santa Rally. It comes on the end of the other seasonal anomaly of ‘sell in May and go away’.
Seasonality is a repetitive price movement that occurs at specific points of time. It stems from business cycles, such as high peak and low peak holiday periods which impact on retailers, for example.
Some take seasonality down to specific micro events, such as the bullish movement of stock indices on the last trading day of the month, or the fact that the ASX tends to be positive on the day of the Melbourne Cup.
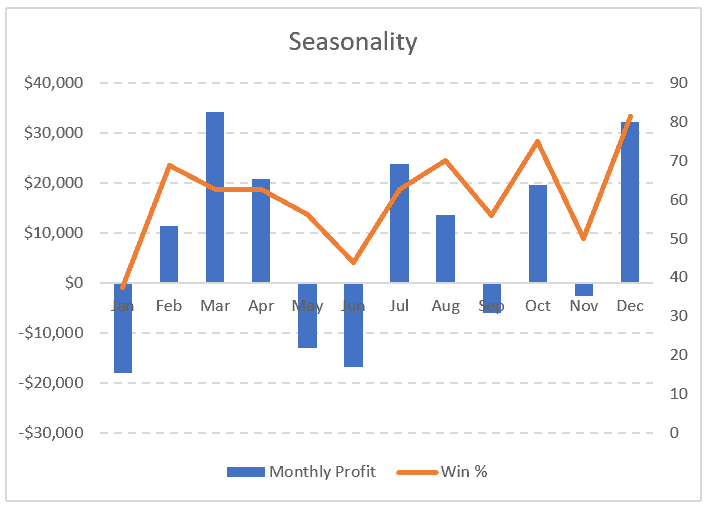
The chart below shows a simple example of seasonality of the ASX, specifically using the SPDR ASX-200 ETF (STW).
In the example, if we buy $100,000 on the first trading day of the month, then exit on the first trading day of the next month, March is the strongest month, although December is the most consistent – positive 81% of the time, and why we hear about the Santa rally.
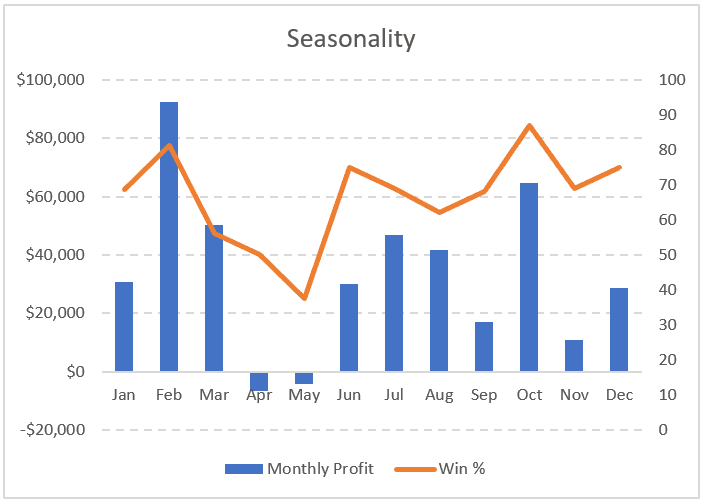
The next chart shows a slightly longer perspective, buying on the first day of the month then holding for 3-months. The February – April period returns the most and is responsible for 53% of the total annual return.
The October – December period is the most consistent with 87% of all year profitable.
The main issue with seasonality is sample size. We’ve only studied 16-years worth of data (The STW was listed in mid-2001) so one needs to be cautious of randomness of the data.
Here’s another article I wrote on the Santa Rally back in 2015
![]()