Review and Assess Your Trading Strategies
Every so often we sit back and assess performance of various strategies, including the discretionary setups from our popular Playbook. For a further look into the setups have a look at our course New Traders Blueprint. When assessing these we look at the market conditions prevailing at the time, position of the setup within the trend, trade management and other measures. Our goal is to learn from these experiences and apply any new knowledge into the future.
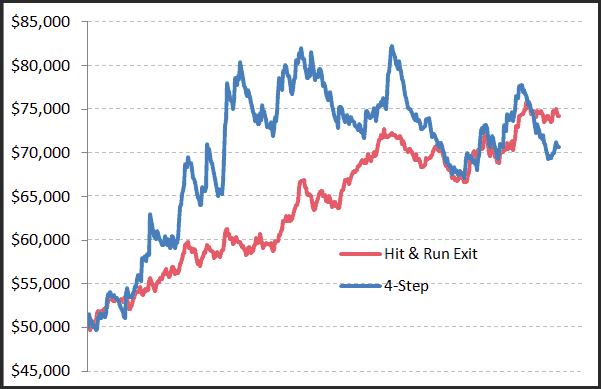
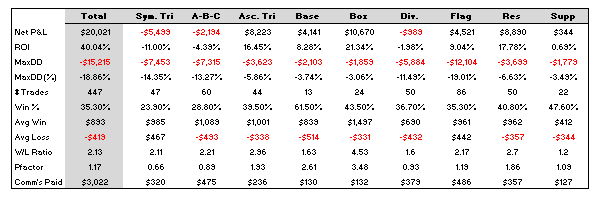
Below are the stats for a variety of discretionary patterns traded in US equities over the last few years. These stats are sourced from our 4-step trade management process (our other trade management process, the Hit & Run Exit, offers substantially smoother returns but doesn’t help analyse the effectiveness of the patterns as such).
Reading between the lines offers some interesting insights. For example, trading the breakout of Base patterns has produced a high winning percentage of trades (61.5%) but hasn’t contributed a great deal to the bottom line. This is a good example of higher winning setups not necessarily offering the highest reward – which is opposite to logical thinking. Compare that to the Ascending Triangle (39.5%), Resistance (40.8%) and Box (43.5%) setups that all have lower win rates yet clearly contributed to greater profits. This suggests coiling patterns, such as Ascending Triangle and Box patterns, exhibit a rapid expansion in volatility and therefore an explosive move.
Looking at equity growth also offers insights into the personalities of certain trade management techniques. The 4-step approach can generate very strong returns in the right conditions, but also offers a lot more volatility and profit give-back in adverse conditions. The Hit & Run Exit offers a much smoother ride with lower volatility and more consistency.