
Pump ‘n Dump Strategy
It seems everyone has a little interest in Pump ‘n Dump trading this week. A Pump ‘n Dump is normally associated with the illegal ramping of a micro cap stock (known as penny stocks) and then selling once the stock price has risen following the surge in interest as a result of the ramp.
One of the best known penny stock advocates is Timothy Sykes who actually attempts to short the stock that are being ramped in order to profit when they come plunging back to earth.
It seems some of his members had an interesting week with the strategy trading a little known US stock called KaloBios ($KBIO). Last week $KBIO traded from $1.90 to over $45 in a matter of days.
Not bad if you had it.
Problem is most discussion has been around a few traders who were caught short and succinctly blew their accounts up.
One guy’s account went from +$37,000 to -$106,000 in a matter of minutes.
Another trader with $11,000 in his account copped a margin call of $56,000. Ouch!
Then strangely enough I receive an email from a reader wanting to know if I could test a similar strategy based on this blog post, which appears to be a loose version of the Sykes strategy of selling these ramped-up stocks. He’s requested to have it tested on the ASX.
For academic purposes I can certainly take a look.
The rules of the strategy we’ll look at are:
– stock has risen > 80% in last 5 days
– is greater than $0.05
– trades more than 500,000 shares
– hold for 5 days then exit
We’ll test it across the entire ASX universe of stocks back to 2000. We’ll include commissions of $8 per trade, a maximum of 10 positions each of $10,000. We will not use any compounding of capital, i.e. regardless of account growth we’ll continue to allocate $10,000 to each trade.
Performance Results:
Start Balance: $100,000
End Balance: $595,257
# Trades: 1329
Win%: 65.7%
W/L Ratio: 0.74
CAGR: 11.2%
MaxDD: -22.7%
Here’s the equity growth chart:
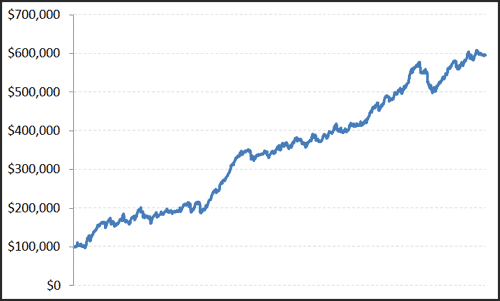
You may be thinking that everything looks very positive with this so far. So let’s start dismantling it a little more.
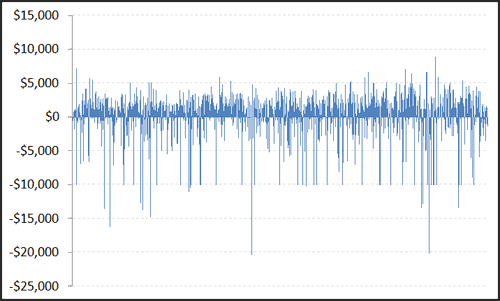
The following charts offer a glimpse into the type of nerve you’d need to trade this strategy. This plots each completed trade. Whilst the strategy has a 65% win rate you can clearly see that the size of the losses can be substantial – many suffering 100% losses and a few tagging 200% losses (short trades have theoretical unlimited losses).
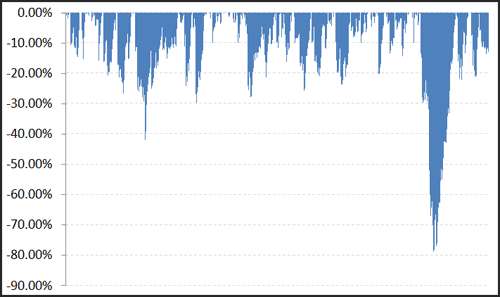
The equity growth chart (above) is actually misleading. It presupposes that realised profits are banked, however, because we’re not compounding position sizes the drawdown as a percentage of the total bank (cash + realised profits) declines as time goes on. By removing this anomaly we actually get a much more accurate insight into the downside that this strategy offers. The chart shows that in a small few months in 2014 the strategy losses some 80% of the account value in just a handful of trades.
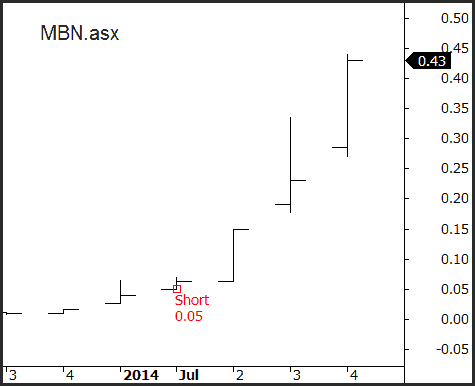
The following chart of Mirabela Nickel (MBN) shows how a trade can go bad. In July 2104 a short sale was signalled at $0.05. Based on our $10,000 position sizing this is an unrealised loss of $76,000 on a $100,000 account. Prices did fall a few days later for a lower loss, but even so, it’s obvious how dangerous this strategy is.
If you still think you possess the brass to trade this strategy then I’ll now completely deflate your aspirations even further. Let me recite a remark from earlier in this article,
“For academic purposes I can certainly take a look”
It’s all academic. This strategy can’t actually be traded in real time. 1239 of the 1329 trades presented here couldn’t be sold short because they can’t be borrowed. According to IG Markets, Australia’s largest CFD provider, there are approximately 300 stocks available for shorting and these are the top 300 – not the micro caps that are really needed. Even Timothy Sykes admits that only a small percentage of his followers can actually execute his strategy as the majority can’t borrow the required stocks to short.
If there is one useful lesson that can be learned from this exercise is that stocks that go parabolic do have a high propensity to reverse course very quickly. If you find yourself on the right side of the trade, i.e. long, then locking in some gains will probably be the better long term option.
![]()