Pattern Recognition: Divergence
Pattern: Divergence
Divergence is a trend reversal entry. As the trade is against the trend, there’s no need for a trend filter.
There are 3 types of Divergence:
- Type A Bullish: Prices reach new secondary low while indicator puts in higher secondary low. Type A Bearish: Prices reach new secondary peak while indicator puts in lower secondary peak
- Type B Bullish: Prices make double bottom formation while indicator puts in higher secondary low. Type B Bearish: Prices make a double top formation while the indicator puts in a lower secondary high
- Type C Bullish: Prices make a secondary higher low, as does the indicator. Type C Bearish: Prices make a secondary lower high, as does the indicator
Divergence requires an indicator to confirm the price action.
I use the Slow Stochastic indicator but you may use an RSI or MACD Histogram. The results will be similar. Make sure however, that you stick with one indicator and don’t chop and change.
The same is true for the look-back period. I use 14 days or bars. You should select a look-back period and test it for some time. Do not under any circumstance use 14 bars one day and switch to 5 the next. You will create all sorts of confusion, which will only result in losses.
Although you will find examples of all types of Divergence being profitable, we’ll only refer to Type A Divergence as it’s a higher probability pattern as prices are being stretched. Once stretched far enough, the chances of a reversal are increased and therefore probability of profits also increase.
The Setup
The setup tends to develop over 10 to 15 days. We need to see a high or low followed by a retracement and a higher or lower retest. When this occurs add in the Slow Stochastic to verify the divergence.
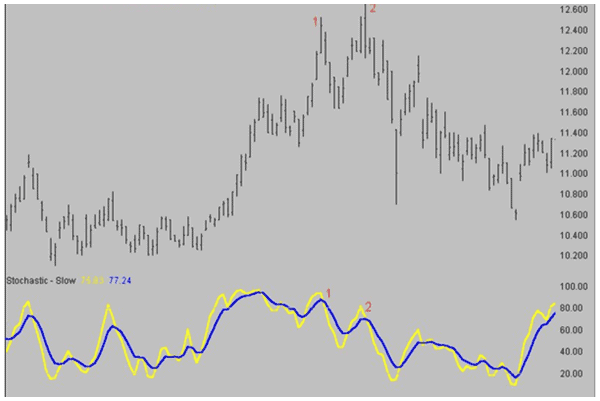
In an upwardly trending market, look for a high followed by a retracement. A retest may then occur which will put in a higher peak. The two peaks should not be more than 8 to 15 days apart. When this occurs, add in the Slow Stochastic. We are looking for the same two peaks on the Slow Stochastic, however, the second peak of the Slow Stochastic must be lower than the first. Remember that this is a trend reversal pattern, so an upwardly trending market will exhibit bearish divergence.
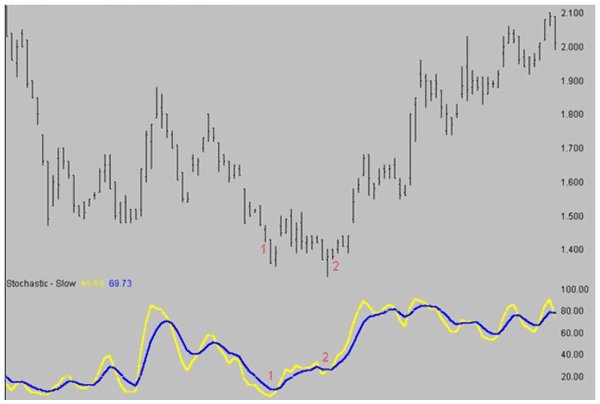
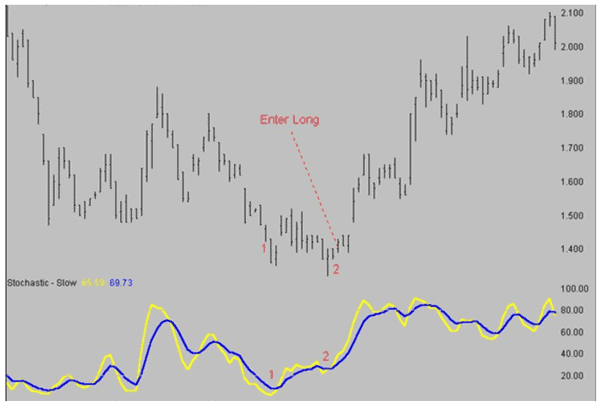
In a downwardly trending market, look for a low followed by a retracement. A retest may then occur which will put in a lower low. The two lows should not be more than 8 to 15 days apart. When this occurs, add in the Slow Stochastic. We are looking for the same two lows on the Slow Stochastic, however, the second low must be higher than the first. Again remember that this is a trend reversal pattern, so a down trending market will exhibit a bullish divergence.
The Entry
Once you have identified the setup, the entry orders can be placed for the next trading session.
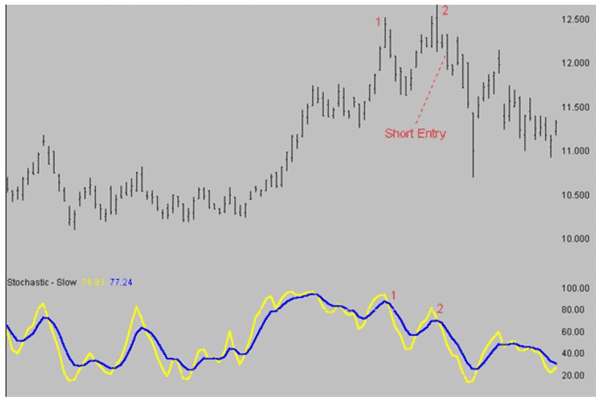
In an up-trend, where bearish divergence is present, place a sell stop 1 cent below the low of the setup bar. The setup bar is the day that swings higher to make the secondary peak. If the market swings lower the next day, you will automatically be entered short into the market.
Conversely, when in a downtrend and bullish divergence is signalled place a buy stop order 1 cent above the setup bar. If the market swings higher from the secondary low, you will be stopped into your long position.
The next step is to understand exits, stops and money management. This information is available in Building a Profitable Trading Plan Using Technical Analysis course provided to members of The Chartist within the Education section.
![]()
Next we’ll look at trading Gaps.