My Achilles Heal
 Imagination.
I lack imagination. I struggle to think up new trading ideas for my systems and strategies. There is always something new to learn. To build upon. To improve. Yet my lack of imagination slowed that process for me.
However, by scouring trading forums, reading books, articles and, these days, joining mail lists and watching social media feeds, I get to tap into other people’s ideas and thought processes.
I get insights beyond my own logic pool.
There are a lot of smart people out there so gleaning ideas then adapting them, or ‘adding colour’ if you like, ensures that I continue to grow my logic pool, my research and perhaps merge some of these new ideas with my current methods. You never know where it will lead, although my experience suggests it leads to exciting new growth for your trading.
However, whilst there are a lot of smart people out there with some great ideas, there is also a lot of hype and garbage that needs to be sifted first. Experience certainly helps me with the sifting process, but as with any process you must validate everything. Never take anyone’s word for granted.
Validate. Validate. Validate.
Just last week the ‘Breakout Box Technique’ came across my desk, sent from the Head of Education at Trading Advantage in Chicago. It’s difficult to refer to this as a ‘strategy’ as really the only point of substance is an entry mechansim. Whilst risk and stops were alluded to, they were basically left to the user to decide for themselves. Here’s the spiel:
The entry for the Breakout Box Technique can be seen on a simple daily bar chart and requires only one simple calculation. You don’t need any other complex indicators or complex algebraic formulas to determine the entry price. Plus, this technique can be used for any publicly traded stock!
|
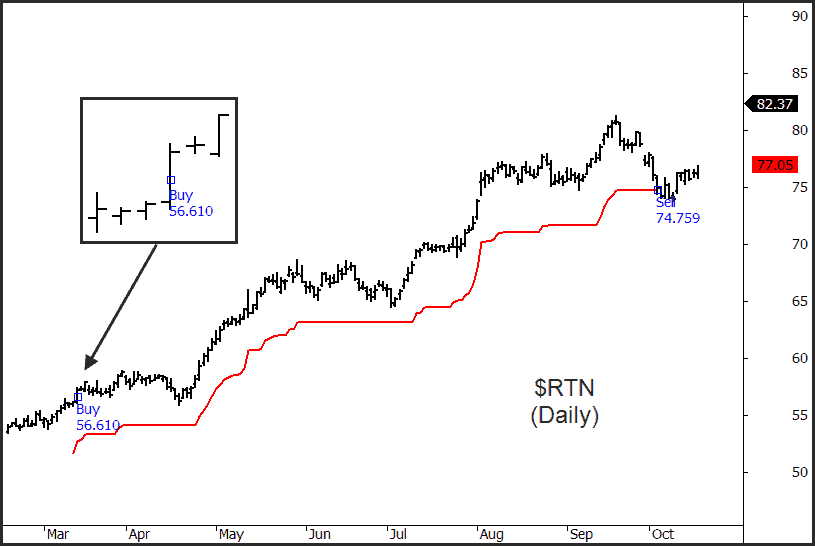
We needed to add a stop loss so for simplicity we used an 8% initial and trailing stop – this being the popular and trusted CANSLIM method popularised by William O’Neil. We used a 200-day moving average of the stock to define its long term trend. The following chart of Raytheon ($RTN) shows a perfect setup with ideal follow through – a 32% gain in just a few months:
Clearly the ‘well chosen example’ is always inviting, but we need to really know and understand what the strategy can and can’t do over many iterations. The only way to do this is to test and validate the strategy using a computer on past data. For our purposes we used the S&P 500 constituent list back to 2000. We included commissions and decided on a maximum of 10 positions with a maximum of 10% of equity allocated to each. Different position sizing models may offer different return profiles, but we need to start somewhere and without any further guidance we used this for simplicity. If the method in its current form has no merit, then no change in position sizing will make any dramatic improvements. It’s lucky we ran our tests. Here’s the equity curve of a $100,000 account:
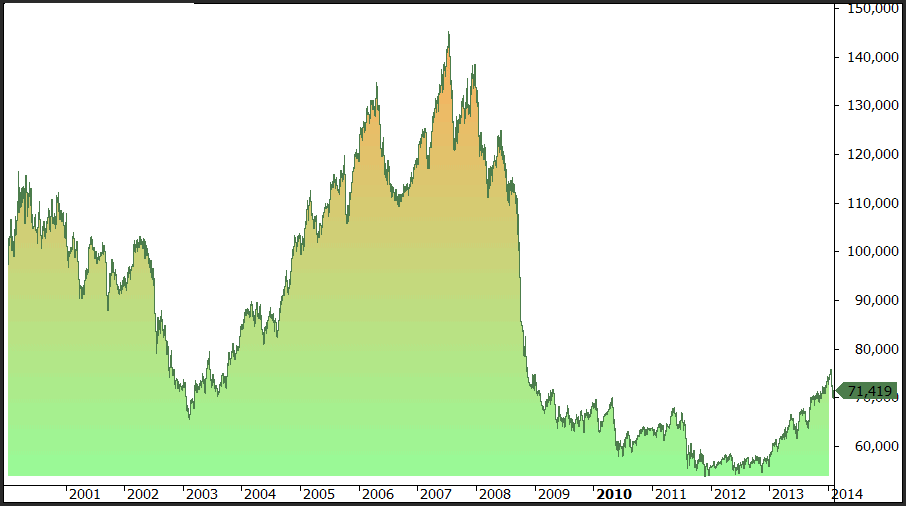
Since January 2000 the strategy, based on our criteria, has made 1593 trades with a success rate of 36.2%. Unfortunately the average win was just 1.65x the average loss which pushed the strategy into a negative expectancy proposition. You can see in 2008 it was clobbered with a 63% decline in equity.
As many of our long term readers know, and as was discussed in Unholy Grails, we place high value on using an Index Filter, not only when following longer term trends but also but also for short term trading. Rarely have I seen an Index Filter not add some kind of value to a strategy. So how will it help this one?
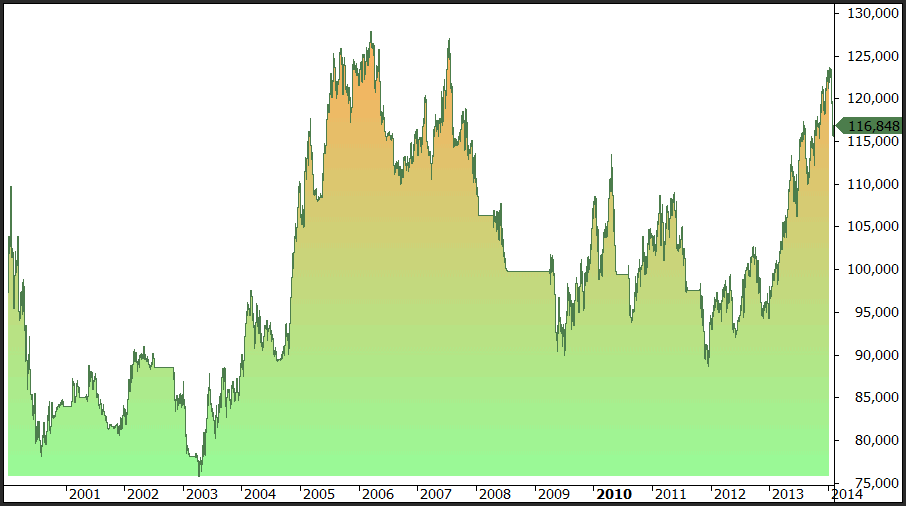
The following equity curve includes all criteria from the first simulation, but also includes a 100-day Index Filter – the same that was used in Unholy Grails.
These results still aren’t startling. Trade frequency dropped to 976, the winning percentage of trades remained static at 36% but the drawdown did drop back to 30.9%. The Win/Loss ratio improved to 1.85, but even so, the annual return of 1.1% isn’t something to get excited about.
In summary, the idea is to check and validate any ideas you may have, or any ideas that other people have that appeal to you. Too often people are influenced by theories that have no statistical backing. Remember the basics of success:
- Find something that works
- Validate it
- Do it