More on the BBO Strategy

In our previous article we revisited the BBO Strategy 10-years after it was first published in Unholy Grails.
You can read that HERE.
The article prompted numerous questions about the strategy so I’ll address two of the more popular ones.
The first was, “Being busy I prefer to trade weekly charts. How does the BBO Strategy perform on that time frame?”
Great question.
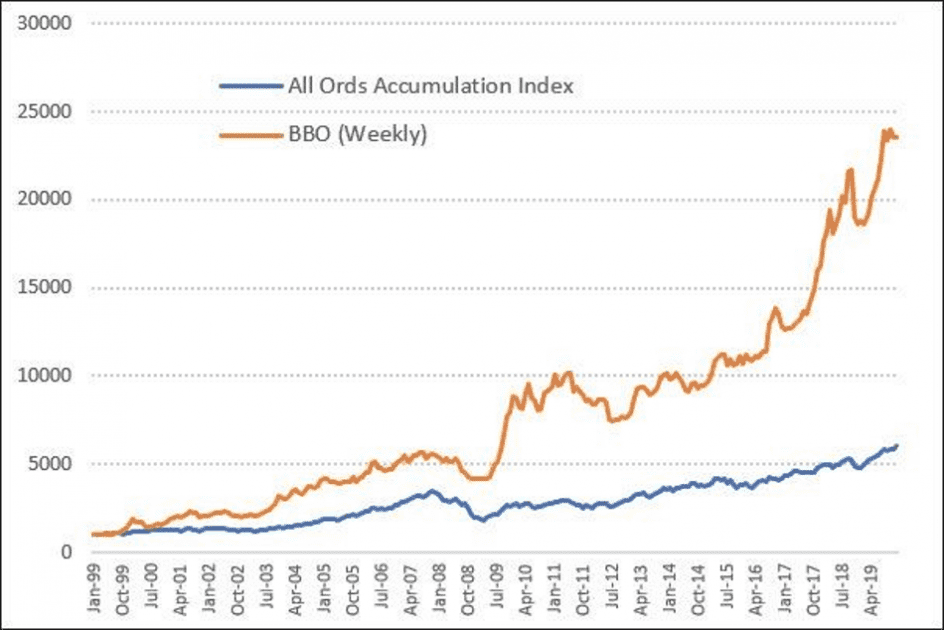
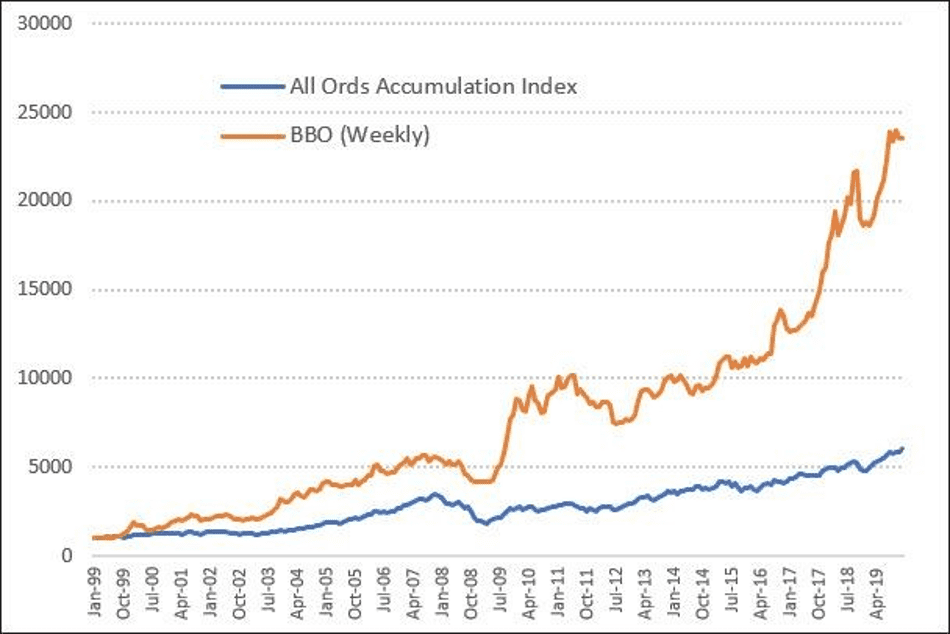
Below is the BBO tested on a weekly time frame. The only amendment was adjusting the 100-day moving average to 20-weeks. As with all our testing we incorporate commissions, dividends and all historical constituents to remove Survivorship Bias.

From 1999, based on 633 trades, the CAGR was +16.1% vs +8.7% for the index. The maximum drawdown was -31.6% vs the index -51.2%.
Another example of the robustness of the strategy.
The second common question was, “How does the BBO Strategy perform in the US market?”
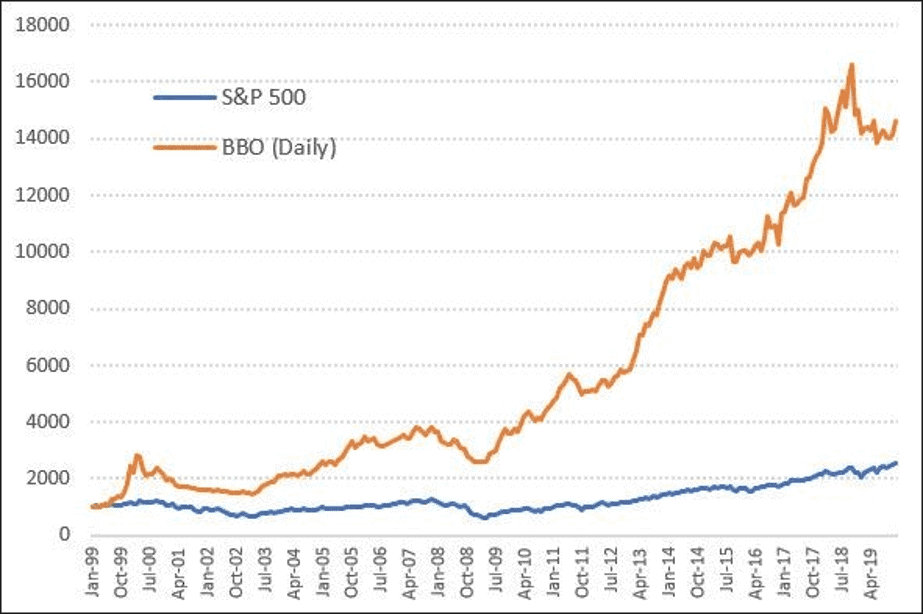
For this test we’ll use the Russell-2000 universe on the daily time frame. We will filter out any stocks below $10 (high commission drag) and use a filter to remove low liquidity stocks.

On US stocks the strategy returned +13.58% vs +4.53% for the S&P 500. Drawdowns were somewhat stiff however; tagging -45% during 2000 – 2002 bear market and just over 25% during 2008.
All in all the BBO Strategy has proven itself to be effective across different time frames and markets.

