
Mean Reversion Questions Answered
Let us help you answer some mean reversion questions.
At The Chartist, we preach strategy diversification. That is, using a variety of trading strategies to smooth or accelerate the overall performance of portfolios. Most people understand momentum-based systems. Today I wanted to address a few points of confusion around our mean reversion-based strategies.
First of all, let’s quickly go over what a mean reversion strategy is. Mean Reversion strategies aim to exploit quick and temporary price movements away from the overarching trend in the expectation that the price will return to its previous trajectory (in other words, revert to the mean). When done across a short time frame, our aim is to rack up many small incremental gains. The sum of which will hopefully provide a larger and stabler return.
Question 1 – We just exited that position, why are we re-entering?
This is one we often receive with regards to our High Frequency and ASX Weekly Swing strategies. It is not unusual to see the same signals repeat within short windows. Occasionally, the High Frequency Strategy will even have an exit and an entry signal for the same stock on the same day.
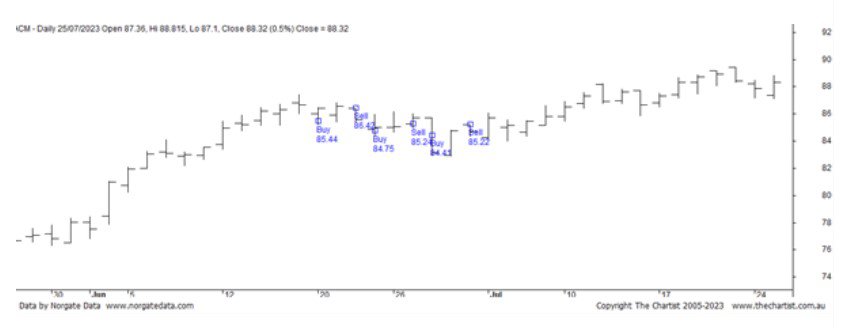
Let’s use the below AECOM chart from the High Frequency Strategy last month to demonstrate. Visually, this chart is a great example of what a mean reversion strategy is looking for. We can see a nice upward trend, a slight drop-off, and then a quick snap back to the upward trend, which then repeats.
If we had bought and held this same stock in one trade for the same period, we would have been worse off compared to the multiple trades.
Question 2 – Wouldn’t it have been better to hold this stock for longer?
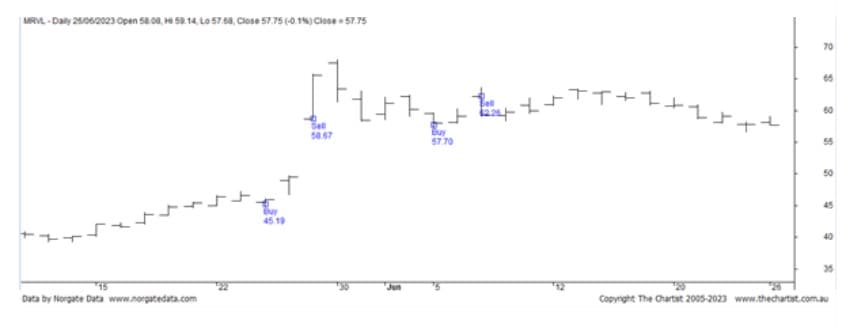
Often, the quick exit of a mean reversion strategy can look less than ideal on a chart. Take the below chart from Marvell Technology, for example. We can see our entry has worked nicely, but our exit has left some profit behind in the following days.
While the question is true for the first trade in the MRVL chart pictured, it wouldn’t have worked out as well for the second trade or for any of the trades from the Aecom chart above. Remember, we’re playing a numbers game here, looking for many small gains rather than a few big ones. We’ve tested these rules across thousands of trades, and chosen the ones that result in the best performance overall.
Question 3 – I placed 20 orders and only got 3 fills; is this normal?
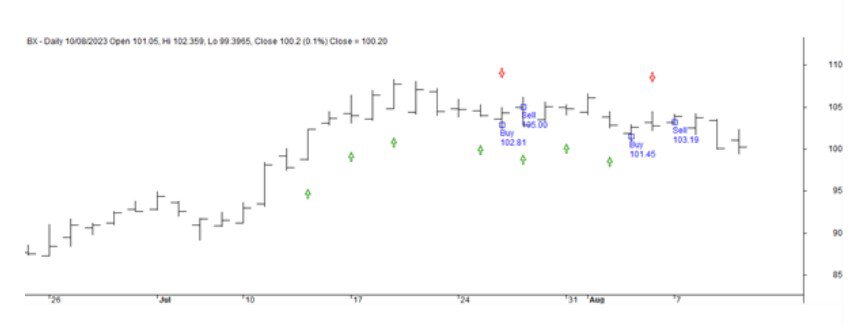
Usually, with this sort of strategy, our entry will be a limit order below the prevailing market price. We do this in anticipation that the price will fall before returning to or above the prior market price. We do not expect all these orders to be filled. A lower limit order aims to maximise the small gain received, while also attempting to avoid entering sideways-moving trades and losing out on the commision.
The below chart marks entry orders for the following day with green arrows; you can see most of them were not filled as the limit was not met.
Question 4 – What broker should I use for these strategies?
For strategies operating at such a high frequency, a broker with a very low commission is essential. This largely limits the strategies to the US market where commissions are lower. We have however developed a variant, the ASX Weekly Swing Strategy, which is designed to operate on a slightly longer time frame using fixed commissions and less entries, to reduce commission drag.
Furthermore, since you’re likely to be placing large quantities of orders, you’ll want to use a broker that facilitates bulk order placement via sheet upload or API.
Hopefully this has given you some insight into Mean Reversion strategies, and how they can be used in tandem with longer term trend following or momentum strategies.
Zach Radge
The Chartist