
Is This Popular Indicator Signaling A Market Correction?
The 200-day moving average is quite possibly the most watched technical indicator on Wall Street. In its simplest form the 200-day moving average registers a bullish or bearish trend. Some even use it as a stand alone trading signal.
Today we’ll take a look at the 200-day moving average from a slightly different angle.
If the underlying index extends itself a long way above the 200-moving average, is the market more likely to reverse?
It’s an interesting and timely question because there’s much talk about US equity prices being over-extended.
And here’s a few other facts:
– the S&P 500 hasn’t dipped more than a 5% over the last 18-months.
– it hasn’t touched the 200-day moving average since October 2016.
– it hasn’t extended more than 10% above the 200-day moving average since August 2013.
The following graph shows the percentage above/below the 200-day moving average.
As of today that extension is at 9.7%.
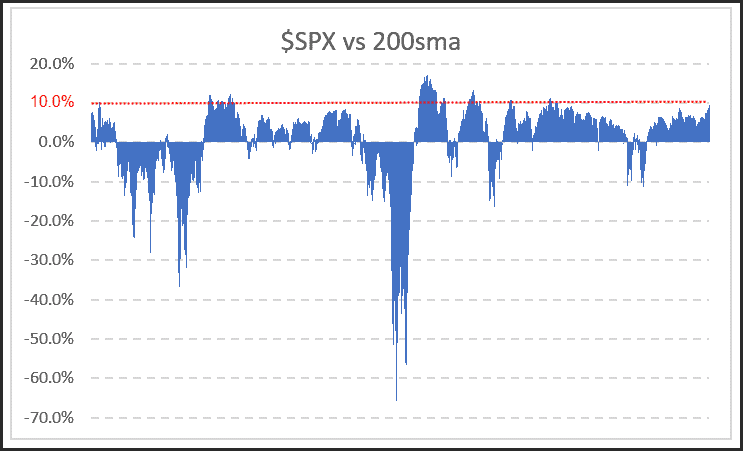
So the question is, if the S&P 500 extends its gap above the 200-day moving average, is the market overheated and therefore likely to reverse?
The following table documents the first date at which the 10% extension threshold is breached. We then look at the subsequent 6-month window for return and interim decline in the index.
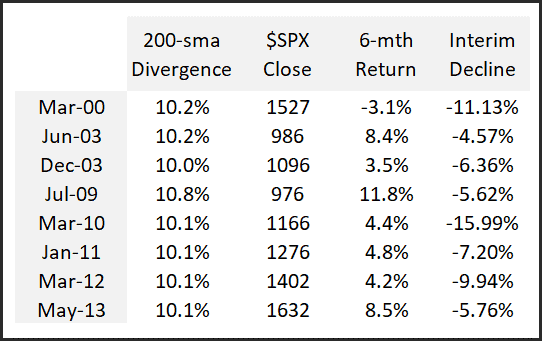
Apart from 2000 the S&P 500 has actually been higher 6-months after a 10% divergence. The average gain has been +5.3%.
The interim declines show an average dip of -8.3%, although during 2011 a double-dip took the market lower to the tune -21.6%.
Does an extreme extension above the 200-day moving average provide enough evidence that a market downturn is imminent?
Not in my opinion.
Declines of 8% are reasonably common. And in many instances 8% declines can occur without any extreme extension above the 200-day moving average.
In summary the market is full of random nuances that have no impact on the overriding trend. Perma-bears tend to latch onto anything that justifies their view, commonly known as confirmation bias.
Instead, you are better to follow a well defined trading plan, such as the US Momentum strategy, and ignore all the noise.
![]()