
Is My Trading Strategy Broken?
2023 is just around the corner and, quite frankly, I’m happy to move on from 2022. It’s been one of those challenging years that pop up every so often.
Mr Market reminding us to stay humble.
My total portfolio is down in the high teens. Many of the big boys around town are down considerably more. Blackrock -33%. Forager also -33% as is Montgomery Small Companies Fund. Sequoia, with an excellent 50-year track record is -36%. Even multi-manager funds, such as the AMP Specialist Small Companies Fund dipped -25% during the year.
Which begs the question: Is my strategy broken?
It is commonly suggested that every trading system built will eventually break. There also tends to be inferences that when a system is out of sync with the market it is deemed broken. I disagree with both these statements. It is logical that a static system operating in a dynamic environment will move in and out of sync with the market. But that is not the same as broken.
So what does broken mean?
A broken strategy is one where performance metrics have moved well outside their usual boundaries and where consideration of the market environment has been taken into account.
For example, if a strategy that normally operates within a maximum drawdown of 15%, yet it has now extended it’s worst drawdown to 25% then without some understanding of why, it’s probably best to stop trading and undertake an investigation as to what may have occurred or is occurring.
If however there was some type of black swan event, such as the COVID crash, that blew the maximum drawdown out of it’s normal bounds, then I would not assume that it was due to a system specific fault. It’s more than likely still a valid option to keep trading.
The analogy here is one of sample. If it is a single event then there really is no significant sample to suggest the strategy is broken. If however, over many hundreds of trades, there remains performance deterioration without explanation, then the system should be shuttered.
Take a look at the following chart.
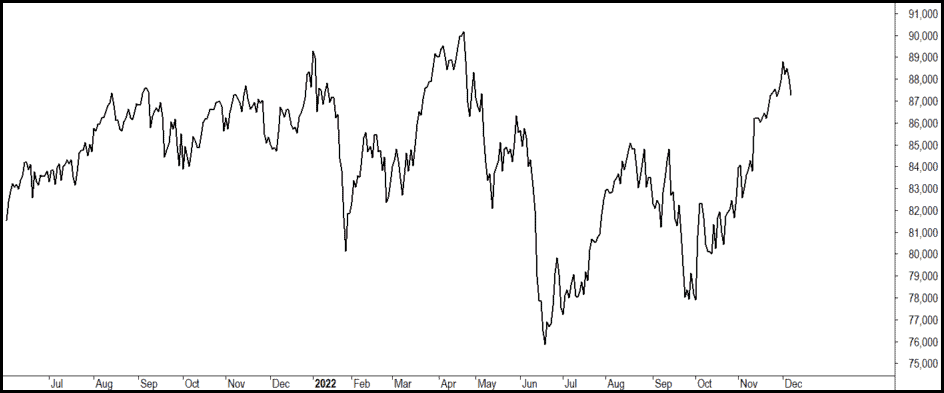
This is the All Ordinaries Accumulation Index. It has moved sideways since July 2021. This answers the question of why a compilation of momentum style strategies has been doing it tough recently.
A study conducted by Vanguard suggested that, “…of the best performing mutual funds in the US, 97% experienced at least five individual calendar years in which they lagged their style benchmarks” and “Short-term underperformance will likely accompany an active fund that achieves long-term outperformance.”
In other words, even the best of the best have periods where they’re out of sync, but continue to excel over the longer term.
And therein lies the crux. Professionals stick at it over the longer term. Amateurs throw it in quickly. And you can bet with certainty, when the amateurs throw it in, the strategy will bounce right back.
Keep pushing the button.
![]()