
Fun Facts and Figures – 2017
Now we are at the end of 2017 I thought I’d share a few interesting insights about the markets…
For the first time in history, the US stock market, on a total return basis, will finish the year with positive performance in every single month.
The last time the Dow Jones actually returned its “average return” was in 1952.
The best day to invest during 2017 has been a Friday, with an average return of +0.16%. The worst? Thursday which returned -0.05% on average.
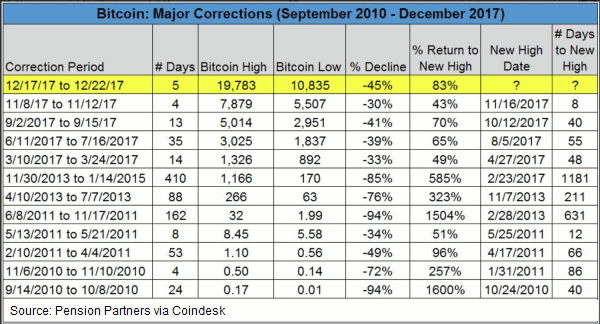
If Bitcoin fell 94% from its recent peak of $19,783, matching its worst historical decline, it would still be (at $1,187) higher than where it started the year (at $968).
Speaking of Bitcoin, the Crypto-kids haven’t been spooked by the volatility.
Apple just made the cover of Barrons magazine showcasing its new ‘golden’ headquarters. Many pundits cite the Magazine Cover Indicator as a sell signal. However, since 1981 Apple has appeared on magazine covers on 138 occasions yet the stock has increased 42,670%.
The largest 25 stocks in the US now account for almost 30% of the total market capitalisation – a new record. Donald Trump must be looking at the same chart.
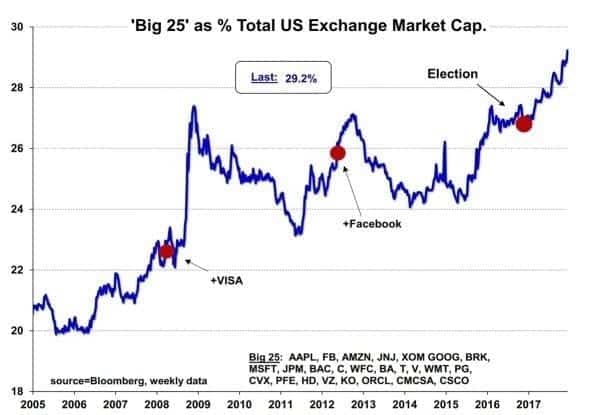
Compare that to Australia where the Big-4 banks represent a whopping 24% of the market cap. The top 10 stocks make up 42% and the top 25 account for 59% of total ASX capitalisation – almost double the US.
The recent move in Copper, positive for 15 days straight, has been the longest up streak in history.
A study conducted by Autorité des Marchés Financiers, the French financial regulator, showed that 89% of retail traders lost money during a 4-year window. Of nearly 15,000 accounts, 13,244 lost a combined €175 million whilst the lucky winners made €13.8 million.
Solution? There are probably many reasons why so many investors continually lose but a major one is that most people come to the market without any plan or without a tested or proven strategy.
![]()