
Exchange Traded Funds
Exchange Traded Funds (ETFs) have been very popular in the US for many years and are growing at an exponential rate here in Australia.
There are many reasons why; limited exposure to individual company risk, extremely low fees and wide array of offerings allowing exposure to indices, interest rates, commodities and even real estate.
One of the drawbacks is that being relatively new, data is limited. The oldest ETF in Australia listed is the SPDR S&P/ASX 200 (STW) which listed in 2001. This ETF tracks the ASX-200 index, has a yield of 6.45% and a management fee of 0.13%. Since listing the total return has been 8.6%
After the GFC I was approached by various financial planning firms looking for a systematic way to keep their clients out of sustained and deep bear markets. While this can be done using a simple timing model, such as a 200-day moving average cross, the benefit is really only during very bad periods of time. At other ‘poor’ times the timing strategy can lag and seriously dilute the long-term return.
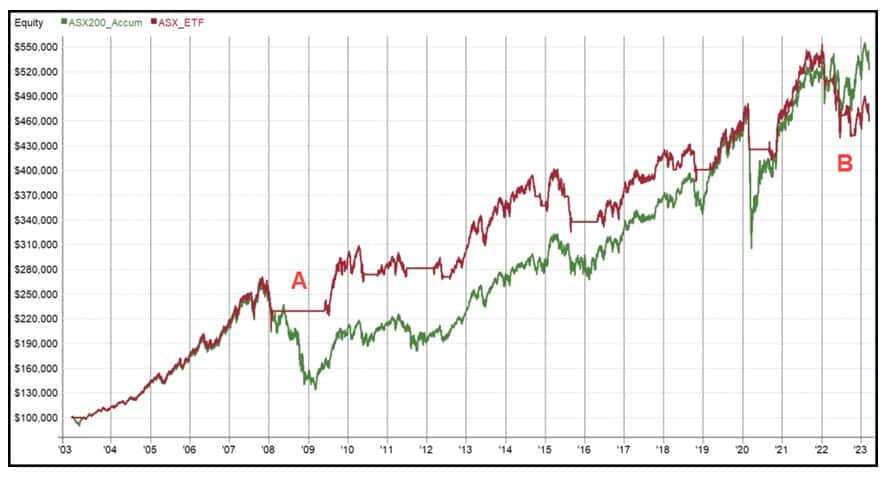
The following chart shows a basic 200-day moving average cross on the $STW ETF. At point “A” the strategy moves to cash which results is outperformance. However, at point “B” the market starts moving sideways over an extended period causing the strategy to chop and underperform. Over the period the CAGR for the strategy is 7.89% vs Buy & Hold of 8.58%. Drawdown drops from -49.3% to a more respectable -23.1%.
Basic 200-day moving average cross on the $STW ETF
Now a hard core advisor might just tell their client to suck it up because the added work for less return makes little sense. Fair enough.
But can we tweak things a little to make a better return with lower risk even if we need to do a little extra work?
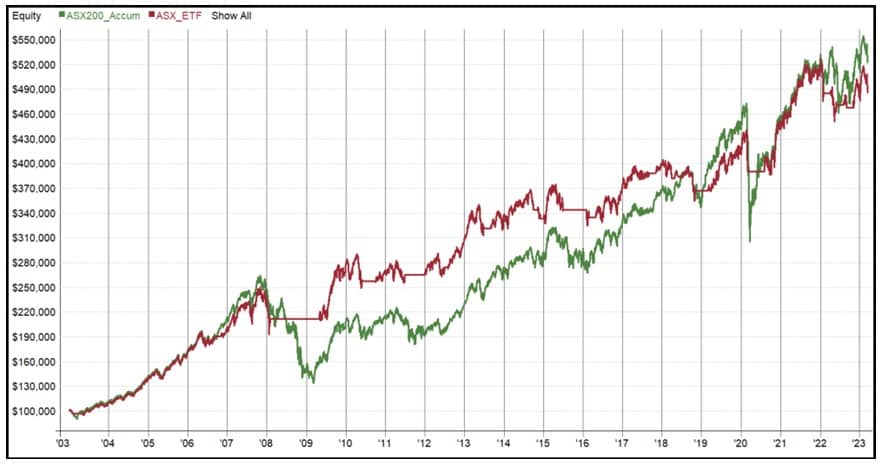
For this exercise, instead of using a slower 200-day moving average cross, we’ll use a 100-day rate of change measured monthly to guage the momentum of the market. This provides a slightly higher return of +8.19% with the same drawdown, but is still short of the benchmark.
100-day rate of change measured monthly
Probably still won’t convince an advisor.
Let’s step it up a little by adding a higher beta ETF which may kick returns up. The Betashares NASDAQ-100 ETF listed in 2015 so on its own we don’t really have enough data.
For this next exercise we’ll combine both the ASX ETF, back to 2003, and the NASDAQ ETF from 2015 onwards. Whichever exhibits the strongest momentum will have 100% allocated to it and we’ll assess it monthly.
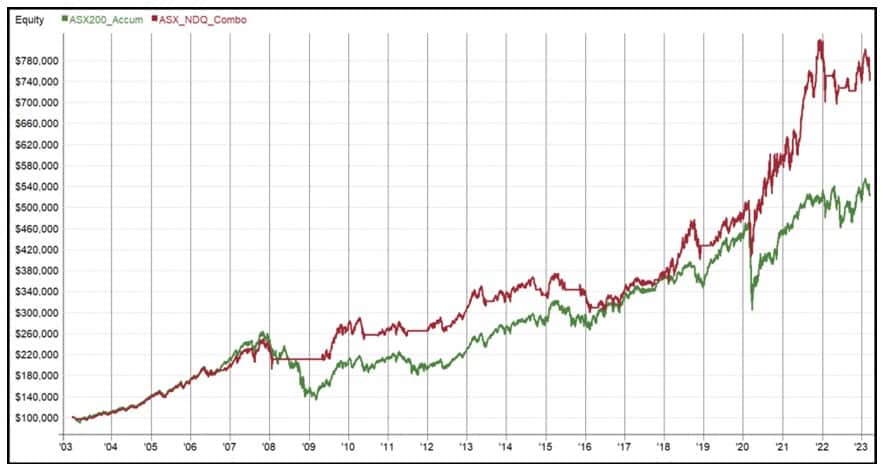
The return profile is looking much strong with the addition of the higher beta NASDAQ-100 ETF. The return rises to +10.43% and the drawdown remains about half the Buy & Hold at -23.2%. We’re only invested 78% of the time and interestingly the STW ETF has performed better in ceratin times after 2015.
Being invested 78% of the time means we’ll earn interest on the cash 22% of the time. Therefore, let’s add in the BetaShares High Interest Cash ETF (AAA). This ETF aims to provide exposure to Australian cash deposits, with attractive monthly income distributions that exceed the 30-day Bank Bill Swap Rate (BBSW). Assets are invested in deposit accounts held with selected banks in Australia.
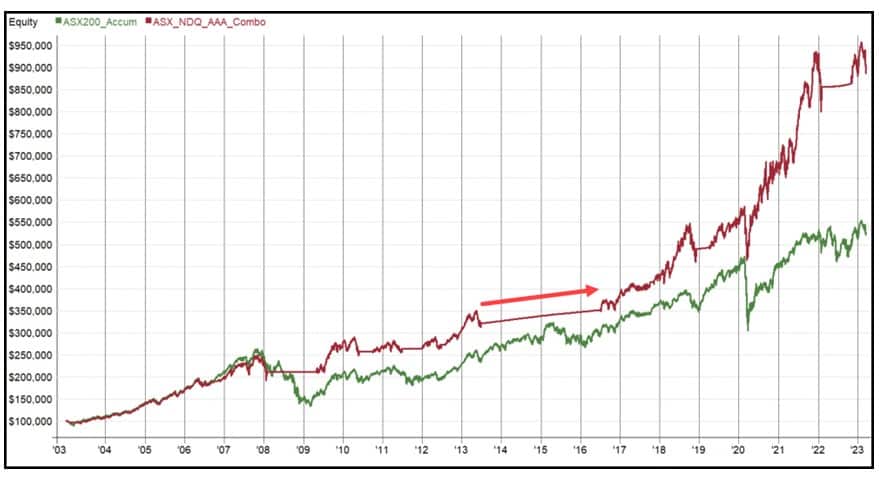
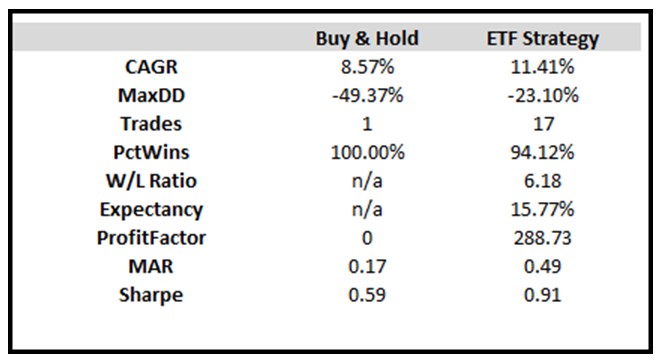
The return now moves up to +11.41% with the maximum drawdown at -23.10%. The AAA ETF was introduced in 2013 so the cash enhancement was not available during the GFC. You can clearly see that during 2014 and 2015 the highest momentum was actually staying in cash.
Below is a capsule summary of the performance.
PS Are you onboard with RealTest multi-strategy backtesting software? Test your own strategies, like I have in this article, or use our turnkey strategies.