
Equity Growth Pathways
I talk about equity declines, aka drawdowns, a lot. Why?
Strangely enough, most retail traders are completely happy when making money, but seem to have significant problems when losing money.
You can view a selection of my articles about drawdowns HERE.
Let’s take a look at drawdowns from a different perspective. Below is the incredible equity curve of Dunn Capital, a billion dollar trend following firm that has been operating since 1974. Every $1000 invested in 1991 is now worth $80,000, and that’s net of a 20% performance fee.
See that red arrow?
That was a 60% drawdown. Yikes.
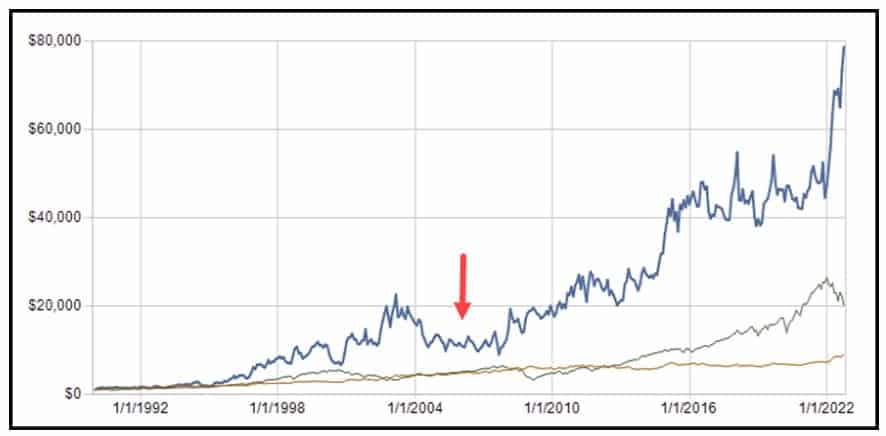
Most retail traders are unable to handle a drawdown of 20%, never mind 60%.
But not Dunn. To counter the drawdown in 2006 they undertook extensive changes to their research programs with staggering impact.
Most changes were induced by improvements in technology (they used computer punch cards back in the 70’s) and more advanced academic studies such as swarm theory but their trend following strategy remains more or less the same as it was designed back in 1974.
So what is swarm theory and could we, as retail traders, put it to use?
If we consider trading the stock market using a simple trend following strategy, our equity growth follows a single pathway. But as we know, stock market prices, while similar to the past, are never exactly the same as the past. They flex, change, and most of the time do so very subtly.
So, the question is, is our single equity growth pathway the best or most efficient?
To overcome this most traders will reoptimise parameters on a regular basis.
The alternate solution, and possibly the better way, is introducing swarm theory.
Consider termites. Individually, they have meager intelligence, they work with no supervision, yet collectively they build mounds that are engineering marvels.
Same with ants. Collectively they’re able to choose the shortest route to a food source from a myriad of possible pathways, even though each interaction might be very simple (one ant merely following the trail left by another).
The following chart is from a recent article I wrote, but it’s essentially a simple form of swarm theory.
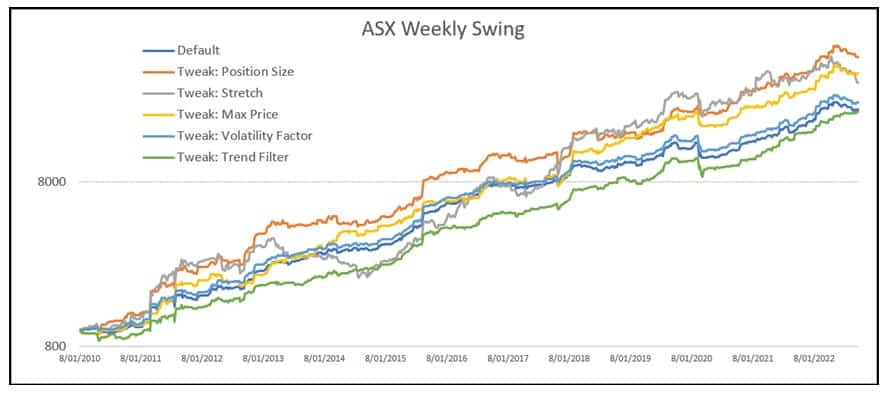
Even though we’re using the same strategy, the slight adjustment of parameters creates different equity pathways. As markets flex, one pathway, or parameter tweak, performs better than others. At a different stage of the cycle, that same pathway may be inferior to another.
This is essentially what Dunn Capital have done. Rather than continuously optimise strategy parameters (chasing one’s tail) as markets changed, they simply created more return pathways using the same strategy.
Or, another way to create different equity growth pathways is to trade different strategies across different markets as discussed HERE.
Drawdowns cannot be avoided, but using certain tools can smooth and improve the trading journey greatly.
![]()