Buy Strong or Buy Weak?
We’ve previously investigated buying weak vs buying strong stocks on an annual basis, specifically buying the strongest (weakest) for the year, holding for the following year, then repeating.
What we found is a lot can go wrong with an already struggling company in the space of a year.
And not many people can sit back and let things go from bad to worse.
We only need to take a quick look at Retail Food Group (RFG) to feel that pain.
But what if we look to adjust the portfolio every month rather than every year?
In this article we discussed buying the strongest stocks within the ASX-100 then adjusting each month.
This week we’ll shift to the S&P 500 and compare buying the strongest vs. buying the weakest. Here’s the rules:
– universe will be the S&P 500 plus all delisted historical constituents.
– each month rank the list using Rate of Change over the last 240 days.
– ensure the S&P 500 is above its 200-day moving average
– buy the 10 strongest (weakest) in equal portions
– hold for the month, then repeat.
– commissions included, but no dividends or interest on cash.
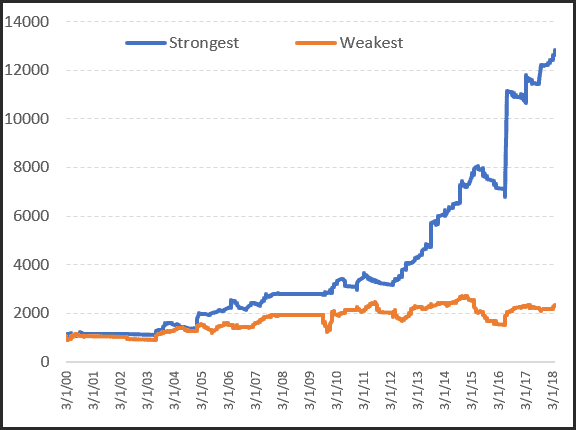
The following equity growth chart shows a clear distinction; buying strength far outperforms buying weakness. Even if we remove some of the large outliers, such as NVDA, there is still massive outperformance.
But it doesn’t stop there.
If we also compare the downside, the pain we need to endure, there is also a distinct difference.
The following underwater chart shows that buying the weakest stocks can lead to some very uncomfortable drawdowns – 3 of which exceed -30%.
Whereas buying the strongest companies result in maximum equity declines not exceeding -15%.
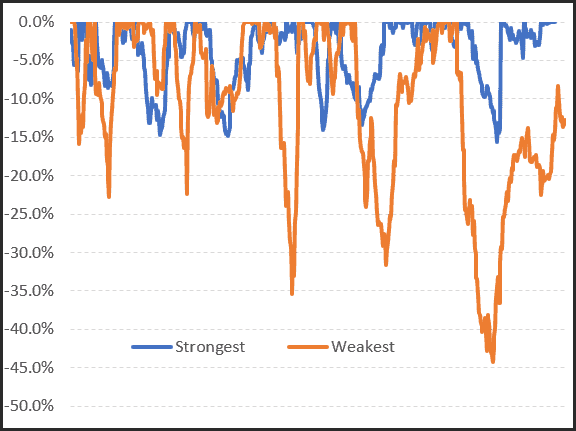
So from an absolute return basis, and a risk-adjusted return basis, buying strength, even using simple rules discussed above, greatly outweighs buying weakness.
We use the same principle albeit with some Radge tweaks in our US and ASX momentum strategies.