
GFC 2.0? Let’s consider a few things
GFC 2.0? This article was written in 2018.
The Australian economy is continuing to show signs of vulnerability and evidence of a nasty credit crunch are emerging; growth is down, investment is down, wages growth is down and consumption growth is down.
Households are not spending. They’re tapped out and under pressure as house prices fall. For the last 20-years the RBA has relied on household debt to meet their inflation targets, but with debt levels at record highs, house prices falling and the big banks are continuing to dampen lending, the RBA is at a crossroads.
The recent Q3 GDP data printed at 0.3% vs the expected 0.6% was a significant shock to economists sending many to suggest the RBA will need to lower interest rates – not tighten as many has expected.
The problem is the RBA is running out of ammunition.
During the GFC interest rates were around 7% with plenty of scope to adjust and make material changes. Not so much now. Indeed the Deputy Governor just called on the big banks to not restrict their lending too much citing a risk that a reduced appetite to lend will curtail borrowing. Clearly this is a worrying sign, especially as it’s in direct conflict with the regulators who, over the last 2-years, have been tightening lending standards to slow the housing boom. Add to this the ongoing China/US trade tariffs and that the US economy is slowly weakening.
Reasons to be cautious:
A shock Q3 GDP print suggests the next rate move will be down
Property prices continue to fall, especially in Sydney and Melbourne
RBA under mounting pressure with credit growth now at its lowest level since 1983
APRA attempting to remove credit squeeze
Household debt to disposable income ratio now at 210%
The US economy is potentially headed for a recession within the next 24-months
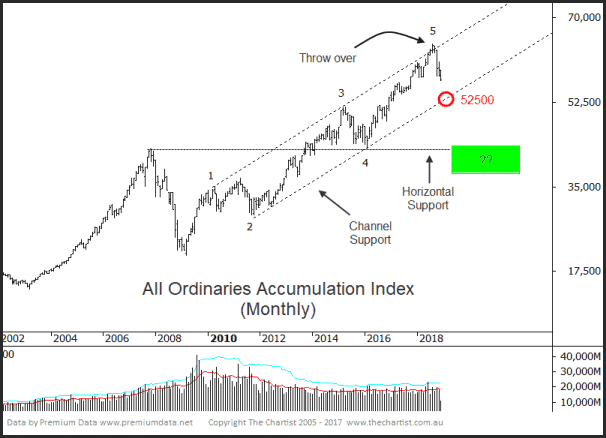
Today’s chart is somewhat different to our usual All Ordinaries chart. What we’ve done is include dividends, in effect this is the All Ordinaries Accumulation Index (XAOA).
Whilst not best practice, the reason I’ve brought this to your attention is the almost picture-perfect 5-wave impulse off the 2009 lows. Wave symmetry is exact, the channels are nicely aligned and we can even see the typical wave-5 ‘throw over’ which is where the top of wave-5 just exceeds the upper channel boundary.
This is a dire chart if the pattern plays out.
But as stated above, the convergence of weakening fundamentals via a looming credit crunch coupled with this unique wave count portends a sizeable decline could be ahead for the ASX.
The typical retracement zone stands between the 61.8% retracement level of 37455 and the 50.0% retracement level at 42650. This latter level, the 50.0% retracement, also aligns with the pre-GFC high and the wave-4 lows. This would represent a 34% decline from the recent highs. Initial expectations, should downside momentum accelerate, would be a test of the diagonal channel support circa 52500.
So what does this mean for you? It’s an important time to be managing your assets and portfolios, not hiding them in the bottom drawer and hoping they’ll come good. ‘Buy and Hope’ is not a strategy.