52-Week High Rotation Strategy
Our research regime centres around improving current systems and ensuring they’re synced to the current market environment.
We also spend time looking at new ideas that can either stand on their own or be used in conjunction with other systems.
The following is an adaptation of a strategy that came across my desk recently. Here’s how it works:
(1) The S&P 500 must be above the 200-day moving average.
(2) Measure the market for stocks within 10% of their 52-week highs.
(3) Rank those by percentage distance from that high point (to 5 decimal places).
(4) Buy the top 5 and hold for one month.
(5) Repeat the following month.
The important rule here is that candidates can only be within 10% of their 52-week high. If not, they’re not included.
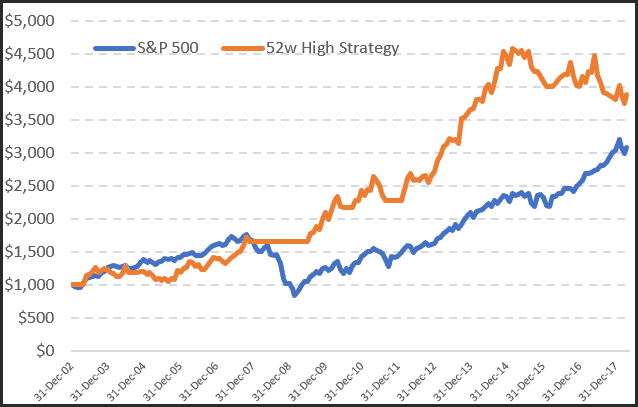
Here’s the equity growth vs. Buy & Hold (including commissions, excluding dividends and interest) since January.
From 2003 through 2015 the strategy generated a return of +13.5% vs the benchmark return of +6.88%.
Drawdown was half that of of the index and the 200-day filter allowed the strategy to perform admirably during the 2008 crisis.
However, and interestingly, since 2015 the strategy has failed to keep pace with the underlying index and is currently in a -14% drawdown.
What we’ve outlined here is a good starting point to building an active strategy to beat the market, protect capital during sustained downswings and without much workload.