200-Day Moving Average Magic
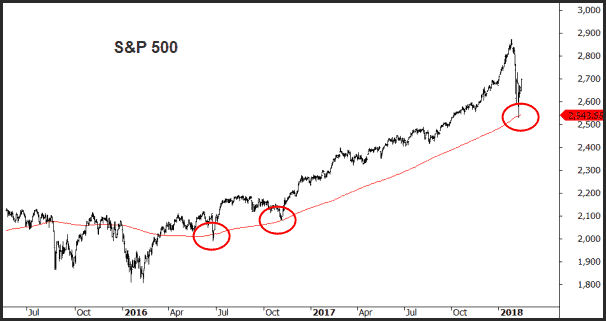
Last week the S&P 500 dipped to its 200-day moving average before turning higher.
The 200-day moving average is a popular technical indicator, especially for US investors.
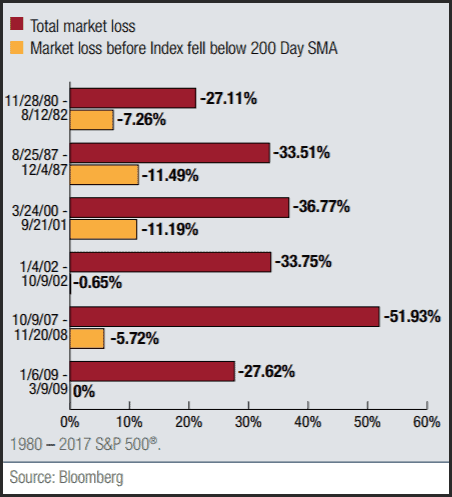
One of the key reasons for its popularity, and why it’s been in the headlines after last week’s plunge, is because it provides a very good precursor to larger bear markets.
The following table shows six large bear markets, where losses exceed 20%, and the corresponding loss prior to the 200-day moving average being undercut.
Being such an important indicator, the question is, “Can I use the 200-day moving average as a signal tool?”
The answer is yes.
It will allow you to be fully invested during sustained bullish markets and provide an exit during sustained bear markets.
However…
One of the biggest drawbacks of using moving averages is whipsaw; specifically when prices move back and forth through the average therefore generating a lot of false signals.
The way to overcome this is something we tested in Unholy Grails (page 77) using the Trend Pilot ETF strategy.
The logic is simple:
Buy when there are 5 consecutive closes above the 200-day moving average.
Exit and go to cash when there are 5 consecutive closes below the 200-day moving average.
In Unholy Grails we tested the theory on a basket of Australian stocks. Considering last weeks developments around the 200-day moving average in the US, let’s replicate the Trend Pilot ETF and run it on the S&P 500 ETF ($SPY).
The following chart shows the equity growth from 1994 through 2018. The strategy made 23 trades with a win rate exceeding 60%.The average win was almost 6x the average loss.
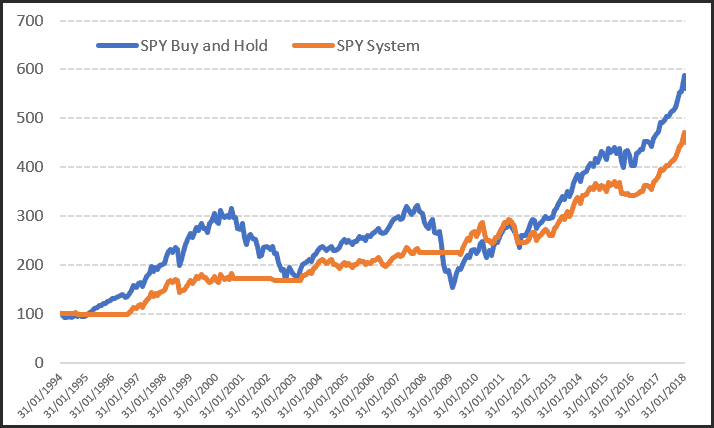
Whilst absolute growth hasn’t matched Buy and Hold, there are two important factors worth considering;
(1) Volatility is extremely low. During the 2008 crisis the strategy was completely out of the market, as it was during the Tech Crash.
(2) This data doesn’t include interest earned on cash. The strategy is only invested 65% of the time, so the cash component would make up much of the performance gap.
For an investor concerned about the downside yet wanting the safety of investing in a large ETF, then this style of strategy certainly has promise.
Nick Radge
P.S. Do you have an interest in designing, building and trading your own strategies? The Trading System Mentor Course is currently open. If you don’t think you are ready to take this step, then perhaps our Beginners Guide to Building Trading Systems might be for you.
![]()