
Trading A-B-C Patterns
Trading A-B-C patterns? It’s a 3-wave counter trend move normally associated with Elliott Wave analysis, but essentially it’s a healthy pause.
Many trend trading techniques rely on a breakout of price, that is, price continuing to move in the direction of the trend with uninterrupted momentum.
However, price tends to ebb and flow, back and forth within the larger trend, which can, in turn, offer up other low risk entry points that are not as recognizable as a pattern or resistance breakout. Then benefits can be twofold; reduced slippage, especially when a line of resistance is extremely obvious to all market participants, and secondly reducing the risk of buying at an overextended point of the price swing.
Indeed more often than not we can often get in very early to a potent part of the trend and execute a perfect swing trade. The downside to the pattern is its a little more complex to pick up, especially using computer scans, so eyeballing the charts tends to be more beneficial if not slightly more time consuming.
However, if you already eyeball charts each and every day these patterns will start to jump out at you.
Next we’ll add some basic rules in order to place as much objectivity on the setup itself as well as the ongoing trade management; in fact on going trade management is extremely easy.
A-B-C Patterns
For our purposes we’re going to be looking at these A-B-C patterns in isolation. That is, we simply don’t care for the larger Elliott Wave count of the intricacies of that type of analysis. We only want to find the A-B-C patterns and trade them on their own merits. In an ideal world we also wish to trade them in the direction of the primary trend, although some of the best opportunities arise when that primary trend is on the turn.
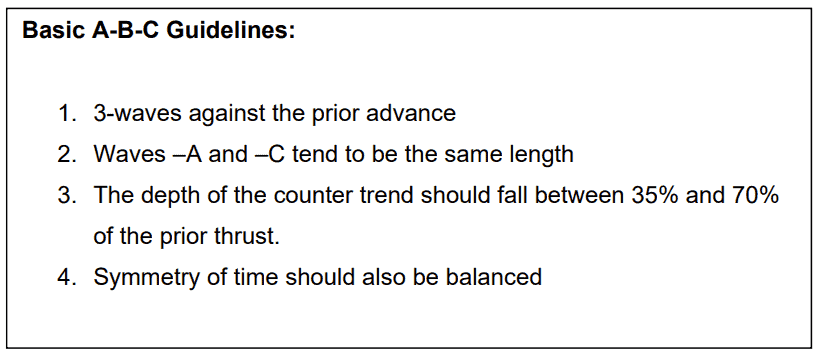
The Primary Trend is UP when the 50-day moving average is greater than the 50-day moving average yesterday. The Primary Trend is DOWN when the 50-day moving average is less than the 50-day moving average yesterday.
Nothing complex in this and usually a quick glance at the chart will suffice in determining the trend.
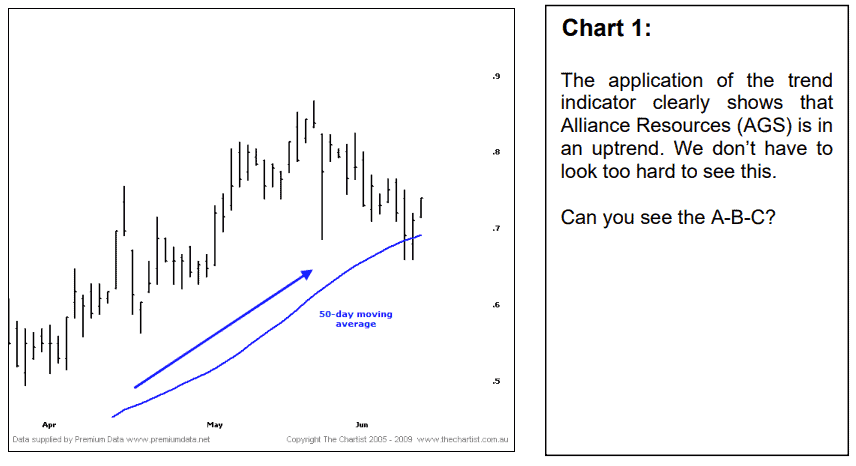
The next part of the setup is the pattern itself, the A-B-C. There are a myriad of guidelines for defining these but the rule of thumb is ‘keep it simple’ If it looks like a 3-wave counter trend move with some decent symmetry, then it probably is. If you need to ponder and guess whether it’s a 3-wave counter trend move, then it probably isn’t. Remember, the profits aren’t made by the pattern. The pattern is simple a comfortable way to enter the trend. Nothing more.
Don’t get too hung up on all these being in place to perfection. We’re traders, not perfectionists, but the key rule is, “when in doubt, stay out”. There are plenty of these patterns around so you can afford to stand aside if you’re unsure.
At this juncture we do not know whether the market will continue to trade higher or whether is will meander about or even fall. We’re not in this game to make forecasts; we’re in it to assess probabilities and create a positive expectancy. Our pattern here allows us to find a comfortable entry point yet more importantly define specifically at what point we’re wrong so we can cut our losses.
Traders Trick Entry (TTE)
Next is the entry which is an area that I have studied for some time and taken the time to watch how others do it, after all, trading an A-B-C pattern is not something new. There are basically two schools of thought when entering; aggressively trying to pick the absolute low point using the Traders Trick Entry (TTE) or taking a slightly more conservative approach to allow a little more wiggle room.
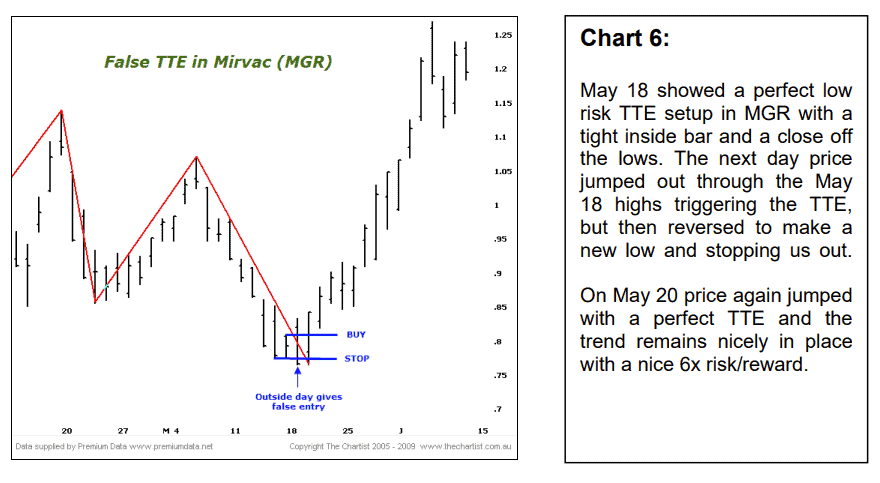
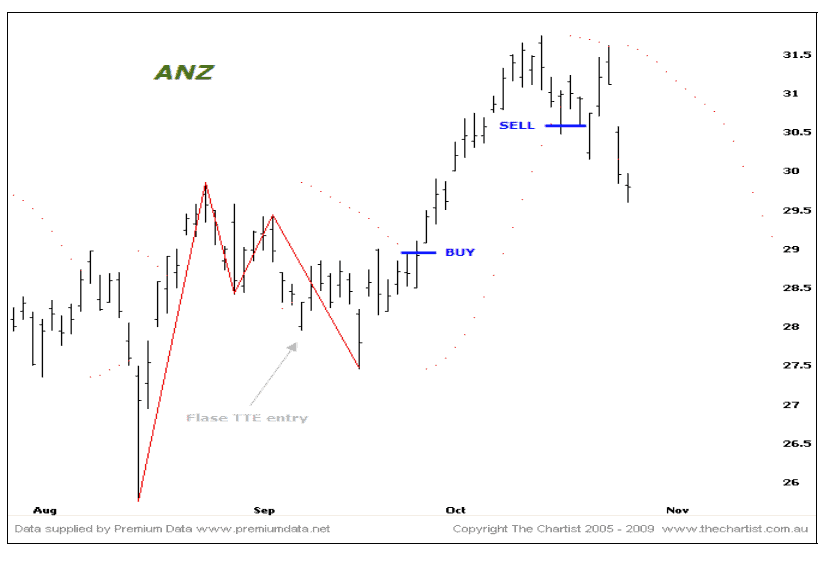
The Traders Trick Entry (TTE) enables the lowest risk on the trade and will therefore allow the highest risk adjusted reward. However, it will also create a lower win rate because it is apt to being stopped out prematurely on market noise. Only the cleanest patterns will offer the best trades. I’m not going to recommend the TTE but we’ll discuss it anyway as it may suit you better. The TTE attempts to pinpoint the low of the A-B-C pattern, specifically the exact bar that makes that low. I stress again that we can’t know ahead of time that this bar will be the low, but we will amend the entry each day until the pattern is triggered or it’s invalidated.
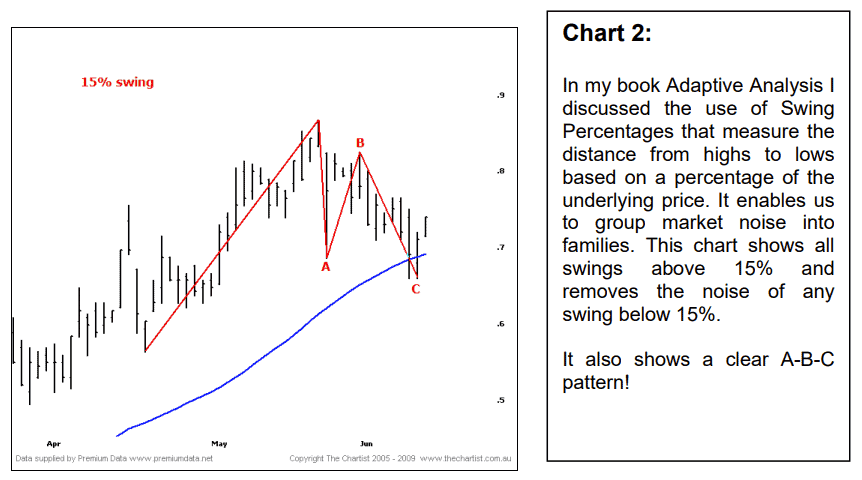
Consider again our chart of David Jones (DJS):
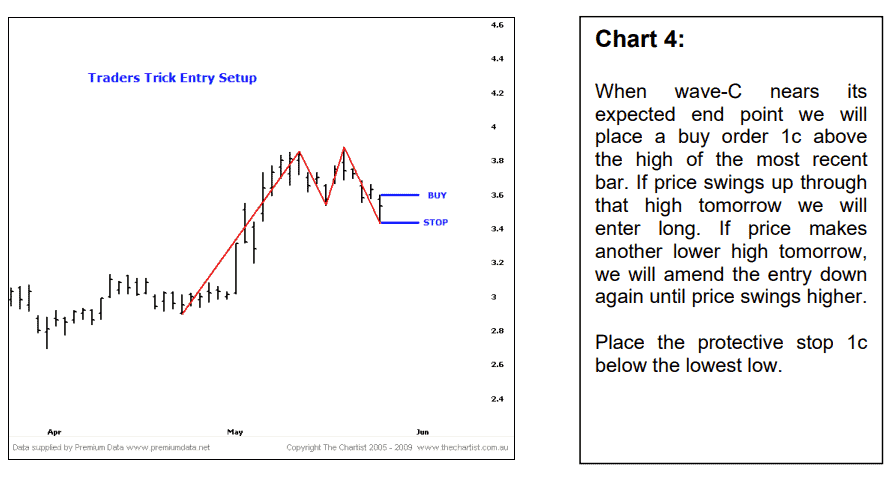
They’re great when they work. In hindsight you can always pick up the better examples and somehow neglect the ones that don’t quite work out. When using these low risk setups we must be ready for a lower win rate. Also be prepared to stay with the setup in case it remains valid for the next trading session. Too often one can get annoyed with the initial stopped trade. Than forego the next signal, even when it’s just as valid as the one prior.
Parabolic SaR
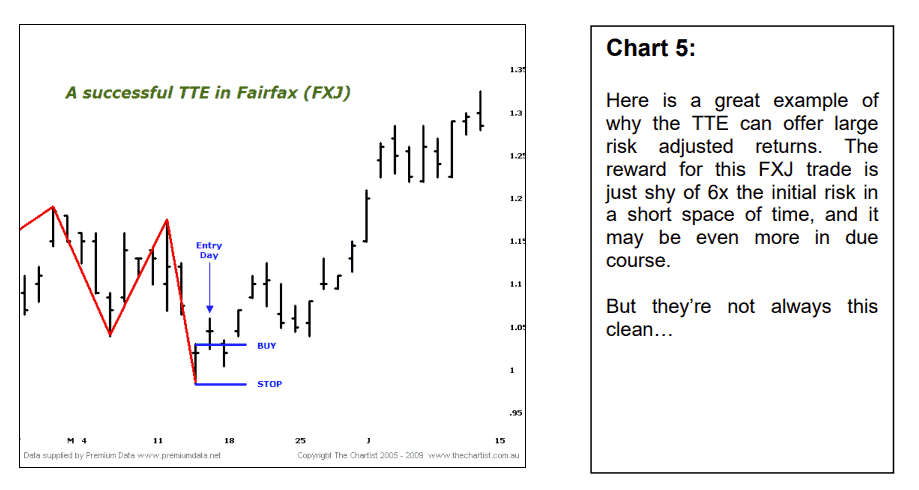
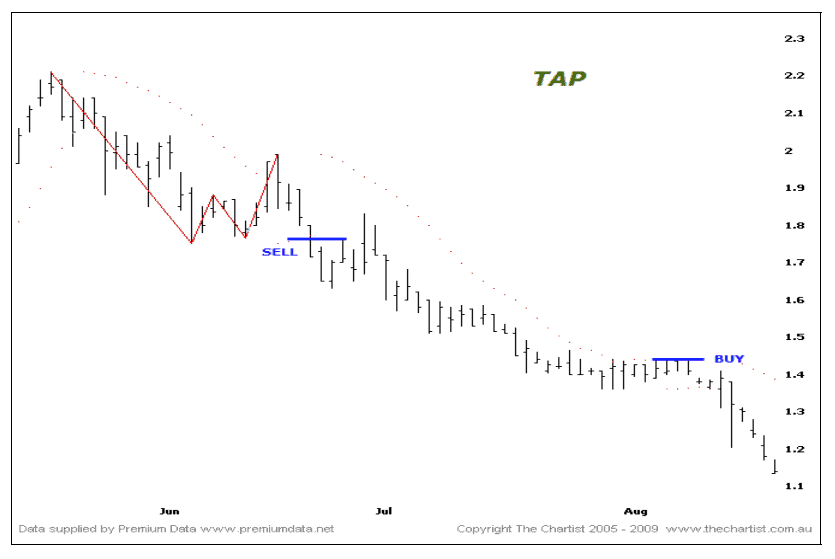
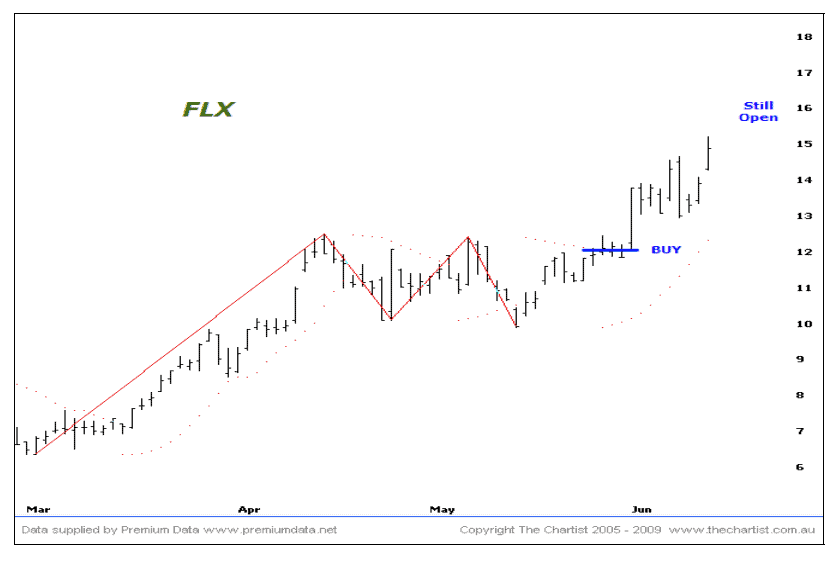
Whilst the TTE is certainly a valid entry mechanism and will provide very large risk adjusted rewards. It may not be for everyone as the win rate will drop below 30%. To increase the winning rate we need to allow a little more wiggle room which leads us to another simple, yet effective and objective entry trigger, the Parabolic SaR.
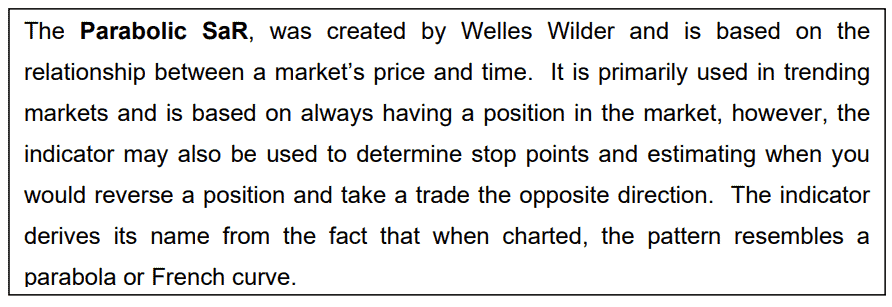
The Parabolic SaR is found on all decent Technical Analysis packages and incorporated with most Broker platforms. The input is known as the Acceleration Factor (AF). Which is set to a default of 0.02 and rarely changed. We’re not going into detail about it here, sufficed to say that there are plenty of references from a Google search should you wish to look into more.
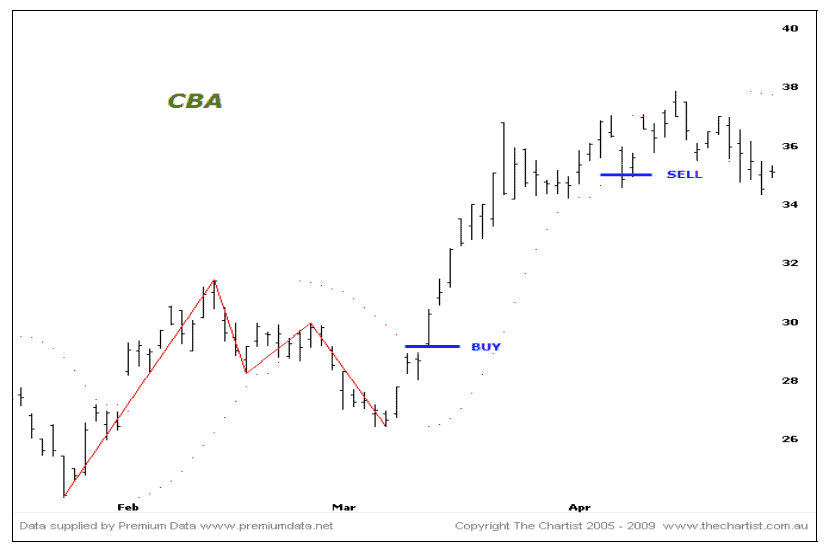
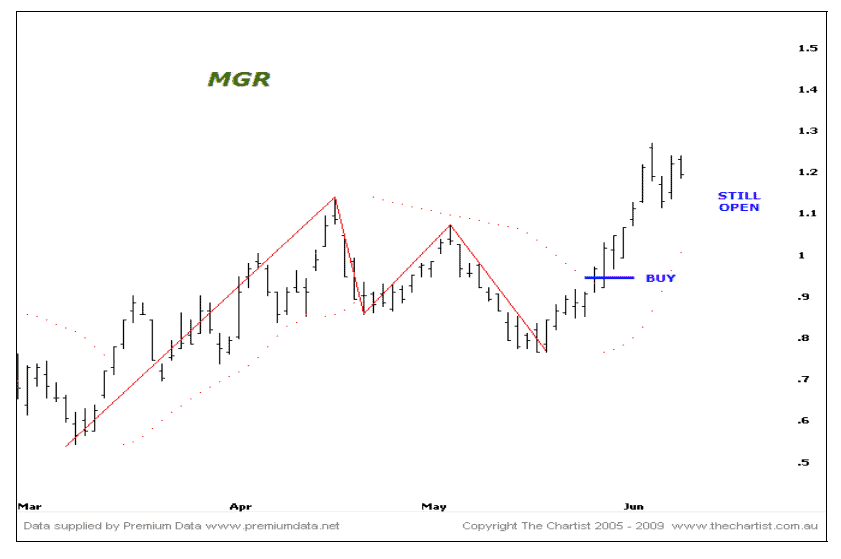
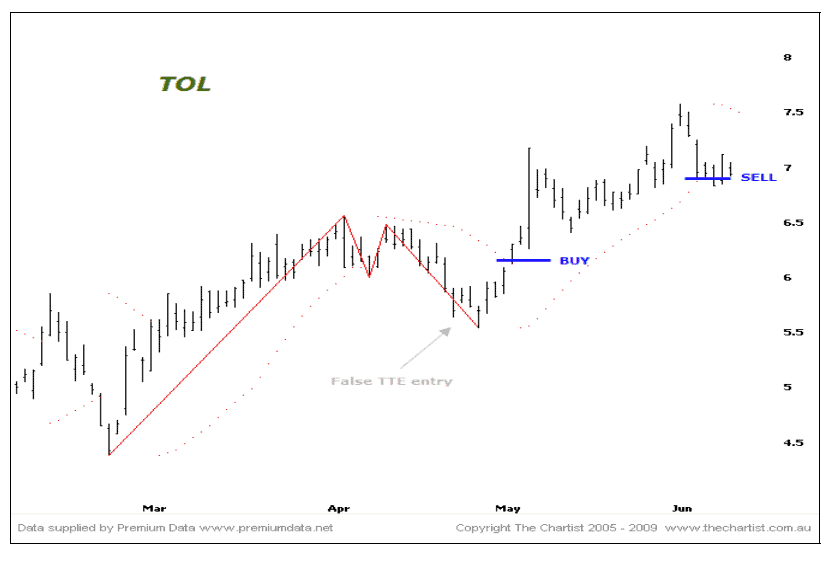
The SaR will serve as our entry trigger level as well as our trailing stop. When applied to the chart the SaR will appear as a small series of dots above and below price. When we see the A-B-C correction the SaR above will become the entry level. Once triggered, the SaR will switch below and then become our trailing stop.
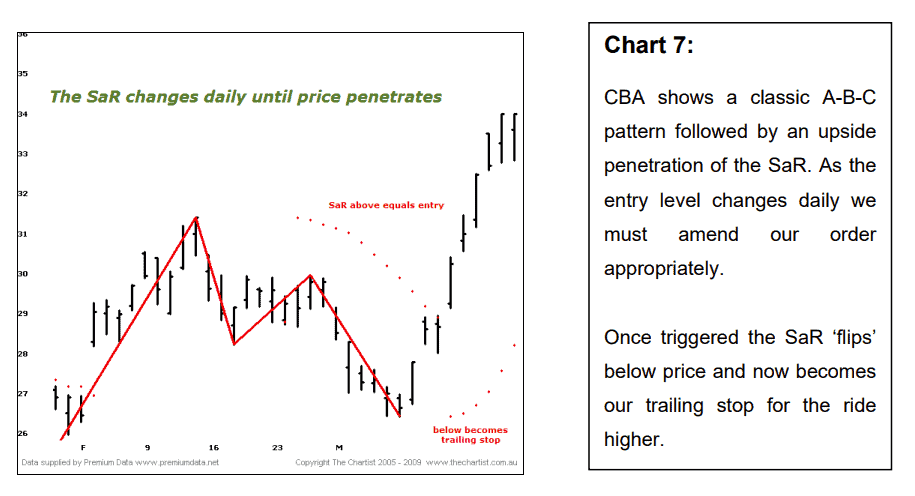
The benefits of using the SaR entry allow better confirmation that the next swing higher has started. As well as offering some buffer from market noise. Whilst we will get a higher winning percentage we will usually not get large risk adjusted rewards like the TTE.
Now that you understand how to trade these patterns with some objectivity, you will find more opportunities from our normal nightly analysis and well as bring them to you in the Power Setups area.
![]()