Ebbs and Flows of Trading
Everything ebbs and flows.
Everything.
The weather. Our moods. Politics. The stock market.
And our trading accounts.
Over the last few years I have got into the habit of reporting my own performance at various intervals.
2020 was a record year in my career. 2021 was also very good to me as well.
2022…well, ebb and flow.
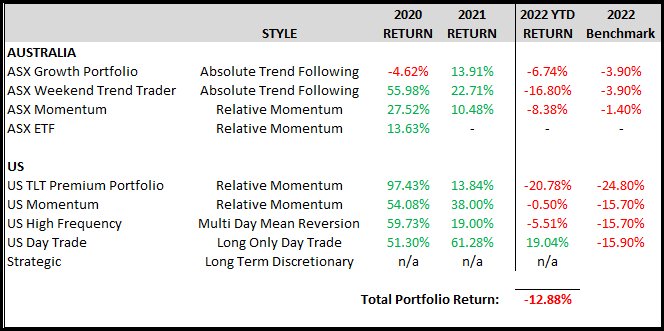
Obviously some red ink here, but consider (a) it’s been one of the worst starts to the year in history, and (b) the full portfolio is down -12.88%.
In my performance update this time last year, I mentioned an ongoing area of focus is on my day trade strategy. I’ve done considerable research on position sizing and portfolio construction with the goal to diversify the trend strategies and keep the equity curve moving during negative periods. After increasing my allocation to this, I’m glad to see it helping the broader portfolio.
I’m reminded of 2020. As at June 1st my portfolio was down around 8%, yet it ripped higher into year end for a record return. Obviously a few things are different now. We had massive central bank intervention back then, and quite the opposite now, but stranger things have happened…
Take a look at the following table from Charlie Bilelo from Compound Advisors.
The first column shows the worst returns through 99 trading days. The second column shows the return from now to year end.
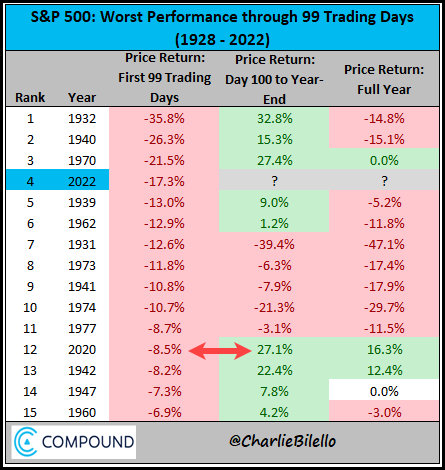
I am not suggesting for one moment that the markets will storm higher in the latter half of 2022. However, probabilities suggest a solid back half of the year is quite possible.
All you need to do is be there for it.
![]()