Is the Market Random or Not?
There has been some major market moves recently, some of which have been historic. These moves haven’t just been equity related, indeed, commodity markets and interest rates have been excessively volatile a confluence of world events takes place.
With that comes a proliferation of statistics about future market moves, specifically, “…if x happens, then the market has a y% chance of being higher in n-period”.
A recent example measured the impact of a negative start to the year. The author stated that, as at day-50 of the new year, if the S&P 500 was negative, then it had a 66.7% chance of being higher a year later.
Sounds like a reasonable edge.
But is it a solid signal, or is it simply noise?
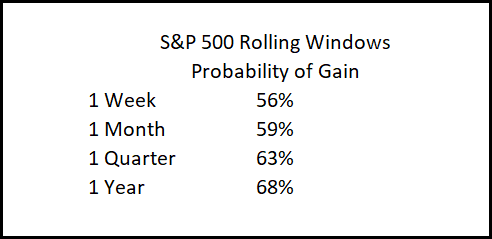
To compare a signal to noise we need to look at the randomness of the market. For this exercise we look at the S&P 500 from January 1928 through today. We measure the probability of gain over a variety of rolling timeframes, i.e. we measure the 1-year return starting from week 1, then starting from week 2 etc.
The following table shows the probability of gain over four windows of time.
As expected, the lower the time window, the more random the outcome. If we went down to daily the probability of gain drops to 53%.Conversely, the longer the time window, the higher probability of gain. This makes sense as the stock market has a long-term upward bias.So any pattern that has an outcome equal to or below random would be considered noise, and not signal.Any pattern that has an outcome above random would be considered a signal, although caveats are needed depending on sample size.
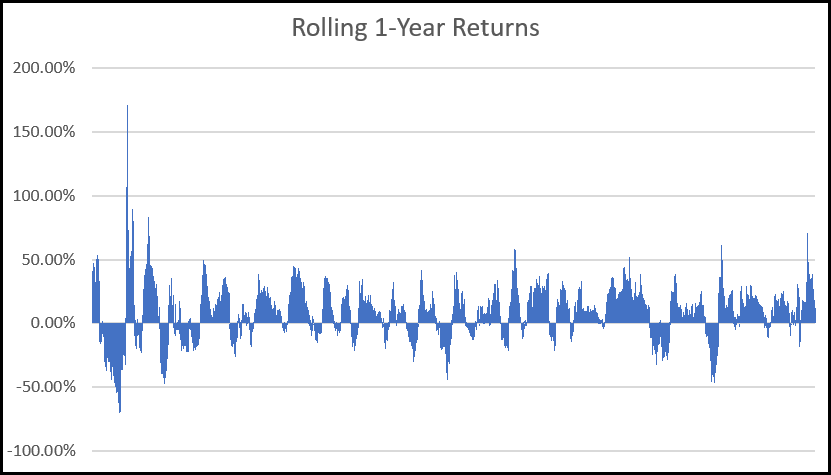
The following chart shows rolling 1-year returns for the S&P 500 since 1928.
Rolling window analysis is also very useful for determining signal strength of trading systems as well as ‘preparing’ the user for the various contingencies that can occur.
Many traders will place some kind of a random time limit on a strategy generating a profit. “If I haven’t made money in n-months, it’s obviously no good and I’ll look for a new one”.
That’s the wrong thing to do.
Armed with rolling window data we can get an insight into the probabilities of success in a time series.
For example, our ASX Momentum strategy has a 92% chance of making a profit in any 1-year window, regardless of the day you start.
This suggests two things. Firstly, it’s a very strong signal and well above random noise. Secondly, to gain a high probability of success, the strategy needs to be traded for a reasonable period of time. 3-months doesn’t cut it, yet that’s what many will do.
I’m a big believer that the difference between professional traders and amateurs is the ability to commit to a strategy over the longer term to ensure success. Rolling window analysis provides the data to make an informed decision.
![]()