
20/20 Hindsight Trading System
I have been mentoring a trader in India – lets call him MJ. He’s inquisitive and doesn’t mind being prompted to search for the answers himself rather than having them served up on a plate. An individual coming to the right conclusions themselves will always have the lessons cemented firmly in their minds. After a number of emails back and forth on how to find robust trading patterns, MJ dropped me an email with a pattern he’d found and ironically called 20/20.
Here’s a chart of the equity growth:
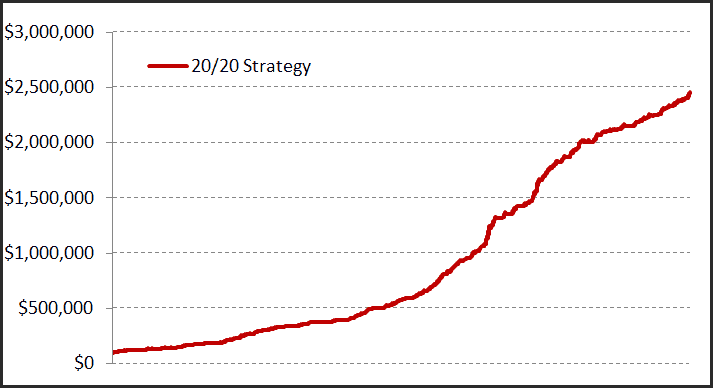
Looks very impressive for sure. The winning percentage of trades is 63% and a win/loss ratio of 1.38. This equates to a 19.5% non-compounded return with a maximum drawdown of -7.5%.
But you know how it goes, “If it’s too good to be true it usually is…”
The first giveaway is the smoothness of the equity curve, especially since this is a single market system, i.e. it only trades one market. This immediately suggests to me ‘curve fit’, but the rules suggest otherwise:
Entry:
Take the average of the last 20 session’s highs. If the close is greater than that average, buy next day at market.
Exit:
Exit at the close.
Simple. Robust. The sample has 2258 trades from 1995 through 2014 and is operated through all sorts of market conditions.
So what’s the issue?
The calculation done by the client contains a post-dictive error.
A post-dictive error simply means that we look at something that happens in the future to make a decision today. Obviously we can’t know what the future holds and therefore todays decision is prone to error. In this case MJ waited for today to close above the 20-day average high – exactly as the rules state, but instead of using tomorrow’s open as the buying reference point, he used today’s open – which has already occurred. He then used today’s close at the exit reference point, and because today’s high was above the 20-day average high it was always going to be a strong close.
A very simple mistake – but a very costly one. Let’s take a look at the comparison between the two equity charts:
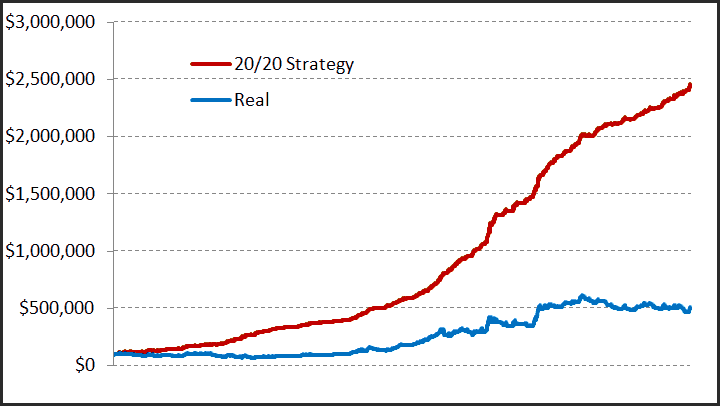
If we now drill into the correctly calculated system we can gain some better insights into the reality of it:
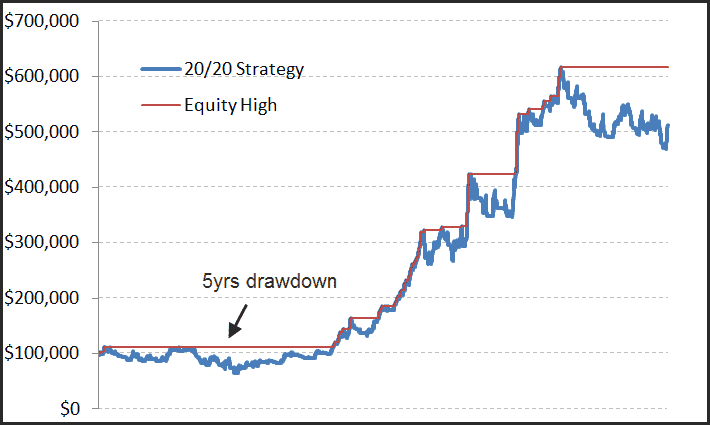
Now we see a very different and somewhat more distressing story. The strategy has 53% winning trades, with a win/loss ratio of 0.99. When playing with such a small win/loss ratio we need to see the winning percentage of trades above 60% to gain some mathematical expectancy. The maximum equity decline is -42.3% with an annual return of 9.35%. Not very comfortable.
Post-dictive errors are quite common. We must remember the old computer programmers motto: “Garbage in, garbage out.” Rather than attempting to prove a strategy right, try and prove it wrong.
If you are serious about learning to design and code your own strategies without making these types of errors, maybe our Trading System Mentor Course is for you.
Looking for some proven trading ideas? Click the button and take the 2-week trial:
![]()