
How To Build A Systematic Relative Momentum Strategy
I’m going to talk about how to build a Systematic Relative Momentum Strategy.
Just to introduce myself, because a lot of you probably don’t know who I am.
About me
As you can tell by my accent, I am an Australian and I started trading in 1985, so just finished my 34th year of trading. I started on the trading floor, the Sydney futures exchange, and then I worked on dealing desks in Sydney, London, and Singapore.
For the first 17 years, I traded only futures and I actually ran my own futures hedge fund up until 2001 and then I switched into equities and I’ll manage money up until 2016.
Now I trade six different systematic strategies. I don’t look at the charts, I don’t draw any trendlines. There’s no Fibonacci’s or there’s no chart patterns or anything like that. It’s all algorithmic trading.
I literally just put my account balance into the model, push the button, it generates the orders, does a position sizing and does everything else. And the six strategies that I trade encompass trend following, which we’ll be talking about today, and also mean reversion.
And I guess the way I like to talk about that is rather than run a portfolio of stocks that is common and what most people do, I run a portfolio of systems and they tell me what to buy and sell.
Analysts and Financial Advisors
So today I’m going to explain why I don’t trust analysts or financial advisors or certain industry types. I’m going to explain to you why there’s a very real casualness to risk and why that’s dangerous, especially to new investors and traders, which I’m sure some of you are.
I’m going to introduce you to systems trading and, literally, show you the kind of things I do. And today I’m going to fully disclose a momentum strategy.
Now, I personally try 2 of these, and what you’re going to be seeing today is not too far different from how I manage my own money and how I’ve done it for, for several decades now.
The beginner’s cycle
Now there’s a lot of information flowing across the internet. It’s through social media. A lot of you would be on YouTube, seen Rayner on Twitter.
You’ve seen me on Twitter perhaps, and a lot of mainstream media and thanks to the internet, it’s actually never been easier to make money.
But because of the internet, it’s actually been very tough for people to stay focused on only one thing until he can get good at it.
I call that the beginner’s cycle where we’re just ploughed with so much information. We just don’t know which way to jump and it becomes very confusing and we go around in circles.
Also, with the amount of information available, yet there are so many traders, investors, having no strategy and still continue to lose money.
Much of the information we get from the internet, we come across as hearsay. Much of it’s ill-informed.
The Trading Floor
Now, to give you an idea, I used to be an anonymous source from the trading floor in Sydney when I worked down there, and one of the major financial newspapers would call me every single day and ask me what was going on many times.
This journalist either didn’t believe me or she just printed what she wanted to print in the paper the next day because rarely did it have anything to do with what I actually said.
So you’ve just got to be careful of who you’re listening to and what’s going on. I guess in this day and age, that was back in the late eighties early nineties and they call it fake news now, but it’s really been around the whole time.
Relying on professionals’ input, or not
Don’t get me wrong, I understand that not all retail traders are swayed by what they read or hear, but many are. And that begets the question, can we actually believe the professionals out there?
Now, here’s some data, and from the Australian market, but it is also applicable to the US market:
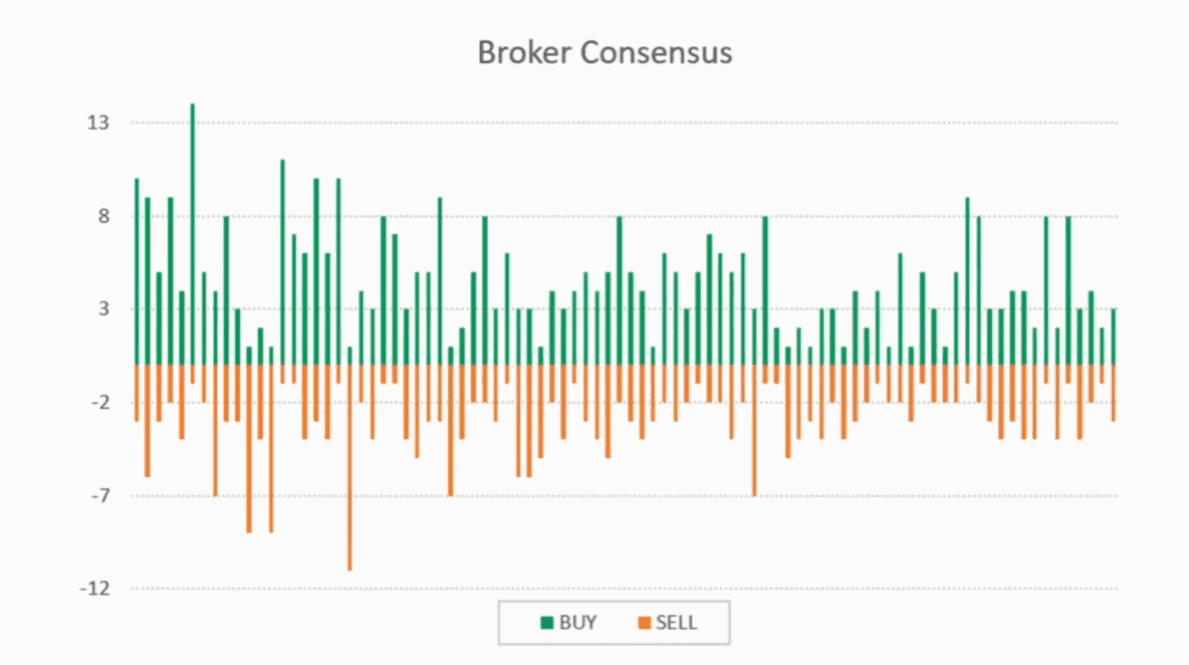
Broker Consensus
This is the broker consensus of the top 150 companies in Australia.
I’ve taken any companies that don’t have 10 analysts covering the stock and I’ve removed any neutral and hold. And what we’re left with here is 89 companies with directly conflicting outlook from these analysts.
So you can see here, some have got big sells and big buys, yet they’re all different.
Now to give you an idea of an analyst: a banking analyst doesn’t look at airlines’ shares, or tech stocks. They only look at banks, live and breathe banks, nothing else.
So how is it that these highly paid analysts can be looking at the same banks, but one comes up with a buy and one comes up with a sell? How is that possible? I’m going to explain that too as we go through this.
My point here at the moment is that we get very conflicting information from the so-called professionals in their business. And here’s another very interesting one here.
This here was analyst predictions at the start of 2019 for where US treasury yields would be by the end of the year:
Now you could see halfway through the year, every single one of them was completely wrong. So my point is that. If these experts have no idea what’s going on, how the heck are we supposed to have an idea?
It basically shows how fruitless the prediction is. Now, to give you an idea why these analysts get it so wrong, and many of you won’t know this, but here’s a straight from an insider.
Quant Analyst
I have a friend who was a quant analyst at one of the big banks in Hong Kong. It’s his job to put valuations on different companies. And the way he had explained it to me is there are 12 inputs into his valuation model.
But here’s the thing, 8 of those 12 inputs are future forecasts. So future forecasts might be what he thinks interest rates are in a year, might be what the US dollar is in a year, might be what the price of gold is in a year.
At the end of the day, eight of the 12 are a forecast. And we know humans are very bad at making forecasts, and that’s exactly why all these different analysts either get a buy or sell for the same stock, even though they’re looking at the exact same information.
Same for a lot of stuff we see out there in the market.
Also, a lot of the analysis and advice that we get from our financial planners, from our stockbrokers, are actually propelled by very common motherhood statements.
We all know what these motherhood statements are:
- Can’t time the market
- The only free lunch is diversification
- You should only buy low sell high
- Active investing is too costly
You know the kind of things I’m talking about, from Warren Buffett, these kinds of things that are very popular. They’re so popular that just take it for granted these days, but are they actually realistic in their views? Personally, I don’t think so.
This view that you can’t time the market. I completely disagree with that. I’ve been doing it successfully for over 30 years. I think you can time the market.
A lot of these motherhood statements are peddled by many in the financial industry and it’s very generic and it’s very easy for them to do this kind of stuff. And I understand the rationale behind it. It’s easy to understand, to sell to a client, to implement and to manage.
And for the advisors out there who you might be taking advice from, all that’s a pretty safe bet for them, but it’s not necessarily particularly safe for you. And why is that? Well, it means that a lot of the time people will remain rational and we know that’s not the case.
If buy and hold was such an easy thing to do and such a great thing to do, how is it that so many people lost so much money during the GFC?
I have personal friends that lost everything, and they were simple buy and hold investors. They were given advice from their advisors. Some of them lost 97%, 98% of their assets very quickly.
Now what we’re seeing at the moment, and this is what worries me, is we’re seeing at the moment across the world, stock markets are hitting all-time highs.
That brings a lot of casualness to the equation. Casualness to risk, casualness to returns, especially for new people that weren’t around 10 years ago.
I’ve been around for a long time. I lost everything in 1987 but I survived the tech crash. I survived the big bear market in ’02, ’03, and I certainly survived the GFC.
But we’re seeing a lot of people new to the market and they’re not going to survive the next time it comes around unless you get a strategy, which is what I’m going to talk about today.
That said, if you’re happy to believe those motherhood statements, if you’re happy to believe that buy and hold is the best thing since sliced bread, go right ahead. It’s up to you.
What makes me different?
But here’s the thing, and this is what makes me somewhat different:
I need:
- to know why and how I invest my money before I risk it.
- know exactly what to do, how to do it, how many shares to buy, where I’m going to get out, etc.
- structure and more importantly, I need rigid evidence that what I’m doing will actually work over the longer term.
If you go and see a financial planner or a stockbroker or an accountant, and you say to them, prove to me your strategy will make me money. They’re probably going armour up and say, well, this is how things are being done, and everyone does it.
But that’s not evidence, that’s hearsay.
I want:
- evidence
- hard statistical evidence
- set of guidelines to follow when the stress increases and decision making can become difficult.
We all remember when Donald Trump got elected a few years ago, I was 100% long US equities according to my models, 100% fully exposed across the board.
And I sat here during my time zone and I watched the S&P 500 futures during their night session go limit down. Now for the average person, they’d probably be choking. And trying to hedge and do all sorts of stuff.
You couldn’t get out of a position because the market was closed, but that November, I finished the month up over 10% simply because I didn’t need to panic.
My decision-making processes were pre-planned because I tested them over decades worth of data, and that’s a very good example of just sticking with the system because you know that over the longer term, it’s actually going to work in your favour.
So if you’re open to thinking independently or if you wish to differentiate yourself from the crowd, then the kind of strategy which I’m going to discuss here with you may well be for you.
What is a momentum system or model?
A true trading system or a true trading model is one that is completely based on evidence. I like to call it evidence-based investing.
Evidence-based investing is about developing very specific rules or repetitive tasks, if you like, that objectively make decisions and allocate my assets symmetrically or systematically.
You can call it quant, you can call it algorithm, either way, what I’m talking about here is a suite of decision-making processes that have been founded on hard data, not on some kind of a narrative.
I don’t care what a company does. All I want to know is if I’m buying at a certain price, that the probabilities will be in my favour over the longer term.
So I’m not trying to predict the future. I’m not investing in narratives. I’m using hard data. It’s a well-known fact.
That many of the top investors in hedge fund managers use these very same principles, these evidence-based strategies: Harding, Renaissance, D.E. Shaw, Graham Capital.
If you haven’t read the Jim Simon’s book that’s just come out recently, take a read of that. The guy is the greatest investor in history, absolutely blows Buffett away by a long way, and he does it all this exact same way that I’m talking about here.
So what differentiates their strategies from this standard finger-in-the-air narrative type strategies that we tend to hear about, or firstly, the rules we adhere to are all-encompassing and they’re dynamic.
So rather than lean solely on diversification, as an example of risk control, diversification is simply a part of the broader equation from controlling risk. And what I mean by that is actually getting out of the market could be a very good way to avoid damage in 2008.
During the GFC, for example, I was completely out of some of my portfolios for the whole year. Some of the other portfolios exited in June, and as a result, I sat there for most of the year sitting in cash and not worried about the world completely failing around me.
That is a measure of risk. That is a position. No position is a position.
The other second thing is these objective rules that I’m going to be talking about today, can be fed into a computer and when you have an extensive database, the output from that algorithm will provide a reasonably good indication of what the strategy can and can’t do, and that’s what’s important to me.
I need to know ahead of time what’s my annual return, what’s my drawdown, how many trades we’re going to make, how long will it take me to get out of a drawdown?
These kinds of information give me the confidence to pull the trigger. And without that, I probably couldn’t. And for a lot of people, they can’t pull a trigger if they’re in doubt.
So let’s get into this now. What I’m about to show you here is an exceptionally robust strategy that you can use on equities, ETFs, commodities, indices, FX, whatever you want. It works across the board.
Relative momentum
It can be adjusted to hands-on, say weekly or it can be very hands-off, say monthly. Or extremely hands-off, say quarterly.
The ones I’m going to show you here are monthly and the two I trade are monthly.
As I said, what I’m going to show you here is very, very close to what I personally do.
So first of all, what is momentum? Very simply, momentum is price, persistence, markets, and specifically individual stocks manifest themselves in trends.
Don’t get me wrong. Trends don’t exist in all stocks all the time, but they do exist in most stocks some of the time.
I would challenge you to bring up a price chart from the 50s or the sixties or seventies and show me where trends don’t exist.
Trends have to exist. They can’t not exist. To say a trend doesn’t exist, which suggests to me that the market is perfectly priced and that there is absolutely no personal sentiment from the participants. And we know that’s impossible.
So simply put price momentum tends to persist long enough to exploit and profit from. That’s basically all we’re after.
Now, here’s a little bit of research and what you’re going to see here. There is a lot of academic white papers out there and they all lead to the same thing.
He has research that extends back to the 18 hundreds, and it shows the excess return of buying the top third strongest stocks versus buying the worst third.
And you can see that the top third, the blue line clearly shows an upward trend and high probability, high profitability over time.
But if you buy the bottom third, you can see it’s a losing proposition.
Now, this was a very similar kind of tests that I did in my book on Unholy Grails. In fact, if any of you have Unholy Grails, it’s on page 4.
It basically compared the returns of buying stocks that are breaking out of a 250-day high compared to buying stocks that are breaking down in a 250-day low. There was a clear edge in buying the strength rather than buying the weakness.
This is a compelling argument for what’s known as momentum.
Now there are 2 types of momentum, absolute and relative. So when we look at an individual stock on its own, this is called absolute momentum. In other words, we’re looking at the stock on its own accord without reference to anything else.
For classic trend-following strategy, some of you may have heard about the turtles, Darvas box or whatever it may be. Even basic technical chart patterns that would be looking at an absolute stock, the stock on its own without reference to anything else.
But what I’m going to be talking about here today is what’s known as relative momentum. And this is when you compare the momentum of one stock to that of another, or to a universe of stocks.
So for example, if we’re talking about S&P 500 stocks, we might be saying, how strong is Amazon compared to everything else in the S&P 500 rather than how strong is Amazon on its own.
So that’s what we’re going to be talking about, what’s called relative momentum. And that’s the comparison of one stock verse, everything else in a particular universe.
Step 1: Select a look back period
When we’re looking at momentum, we want to pick a time window, to see what the strength of a stock is over a certain window of time.
That can be 3 months, it can be 12 months. Most academic studies tend to focus on 12 months, which is exactly what I do. So that’s what we’re going to focus on today.
So select the lookback period. That’s your first step to building this kind of a model. So our look back period is going to be 12 months now.
The $64 trillion question is how do we measure momentum? Basically, momentum is the price gain over that period of time and our case over the last 12 months.
So that’s called the rate of change, and that’s what I use. But other people use something different. Andreas Clenow, who some of you may have heard, he’s just recently been speaking up in Asia, he uses linear regression as an example.
There’s plenty of ways to measure price changes over a period of time. But personally, I use the rate of change.
Step 2: Calculate momentum and rank
Now then what we do is we measure all the stocks in our universe and then we rank them. And the simple way to do that is via the rate of change for that price periods.
So the stock that has the highest rate of change over the last 12 months gets ranked number one. Our research also suggests that you can divide that momentum with the volatility of the stock as well. And again, you would rank it so stocks with the highest rate of change and the lowest volatility would be ranked the highest.
Step 3: Equalise volatility (or not)
So the next step is to decide how many shares to buy and there are a few ways to do that.
One way is to take into account the volatility of the underlying security. And basically what this comes down to is the more volatile the stock, the less you buy and the lower the volatility of the stock, the more of it you would buy.
So we equalize the position based on the volatility. Now that’s one way to do it. One of my models does it that particular way.
The other way is you can use an equal weighting method. So for example, you might want to have 10 positions and each position is allocated 10% of the available capital. So my other model operates on that basis.
Two different models, doing slightly two different things, give slightly two different results.
There’ve been various studies that show that the equal weight allocations do actually outperform. This is explained by skew. I don’t want to get too technical on you, but that’s when you get very large positive returns on just a few stocks, which will offset the modest or negative returns of the average stock.
So there are these two ways to do it. I do both on the different models simply for diversification purposes. That’s the whole idea. I don’t try and optimize it.
Step 4: Align symbol and index trends
Now we’ve all heard of the phrase, a rising tide lifts all boats and a falling tide tends to drop all boats. This is an incredibly important step in the whole equation.
Don’t get me wrong. During the GFC, some stocks did rise, but by and large, the extreme majority of stocks fell.
This particular rule is to get involved in the market. We want to use a two-step approach. We want to ask the question is the broader trend of the market up? If it’s yes, then we want to invest.
If it’s no. We don’t want to invest.
And that’s the exact reason why I didn’t participate in a lot of downside in 2008. Some of my systems, as I said before were 100% cash.
It wasn’t because I was smart or because I predicted what was going to happen. To put it simply, and this sounds incredibly simple, but it’s true – the market trend was down.
I was sitting in cash waiting for that trend to turn up. So if the broader trend is up, I’m involved like I am now. I’m 100% invested for one reason. The broader market trend is up.
I don’t know how long that’s going to last. It could last a day, a week, a month, another 10 years. I don’t know.
But whilst is up, I’m going to stay invested. If it does turn down, I’m going to get out.
There’s a lot of empirical evidence supporting this fact, and again, I stress it and show you a lot of tests in my book Unholy grails.
Then the next step, what we want to do here is we want to ask the same question of the individual stock.
So our first question is the broader market up or down. Then we say the same thing to the individual stock. Is the trend of this individual stock up or down?
If it’s up, yes, we want to invest and if it’s no, we don’t want to invest, and this is where my momentum models get a little bit different from what you can read about in academic papers.
Academic papers will continually invest regardless of whether the stock market itself is going up or down, or whether the stock price itself on the individual stock is going up or down. I don’t do that. I want them all to be going up.
But a lot of the white papers, they’ll invest all the time. Now, why would you go long stocks that are in a sustained bear market? It makes no sense to me. So that’s that very easy rule.
Step 5: Buy new, exit old
And the last thing to do is to actually execute these, these rules.
Now you can do it weekly. I prefer to do it monthly. I can’t see any evidence that doing it earlier than a month makes any difference. There’s no empirical evidence that I can come up with that shows as a benefit to doing it.
So literally what that allows me to do is rank the top stocks after the close of business on the last day of the month.
For example, after the close of business on the 31st of December. I’ll run these models. They will measure the rate of change in these markets for the last 12 months. They will then rank those stocks in order of that strength.
Then the system will ask the question, is the market going up? And it is, and then we’ll ask the question, are these individual stocks going up?
And if they are going up, then I will buy the strongest ones. Simple as that. And then I just repeat that. Every single month. It’s as simple as that. Repeat from step two.
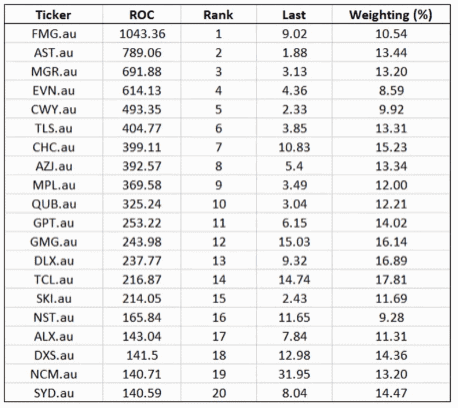
So to give you an answer, here are some of the top Australian stocks:
It works exactly the same for every other market in the world. Doesn’t matter if you’re in India. It doesn’t matter if you’re in Belgium or the US or Canada to go and be exactly the same.
So here’s a long list of the top 20 stocks in the ASX 100 measured by the momentum. And what we’ve got here is using a ranking that divides the momentum by volatility.
And in this particular case, for example, let’s say we wanted to have a concentrated portfolio of just 10 positions, and what we do here is we take that top one, which is ticket FMG.
It’s ranked number one and it’s saying there that I want to buy 10.54%. Of my portfolio money to buy that stock, and then with AST, it’s obviously not as volatile. I would buy 13.4% of that, and I go down the list until I’ve spent 100% of my money.
So the major differences here are:
- The more volatile the stock, the less you will buy it
- The less volatile the stock, the more you will buy it.
And that will change on a regular basis and you can adjust that. Personally, I don’t, but some people do. I just buy the position and let it sit until I get an exit.
Now, some of you probably just have a question on that. You’re probably going to say to me, well, how do you exit a position?
That’s a good question. Well, you exit the position when it falls out of that top 10 rankings.
So say for example, here, I buy stocks one through 10 on this list. So if FMG all the way down to QUB, I hold them for a month and the next month I do the same exercise.
Now if QUB drops to number 11 and GPT comes up to number 10, I’ll sell QUB and I buy GPT, and I continue to hold all the other ones.
You’re just repeating this process and what you’re automatically doing is holding the strongest stocks all the time. You’re never holding a weak stock, you’re always holding the strongest stocks. So we’re always buying that strength.
We can feed these rules into a computer. The software that I use is AmiBroker. Earlier on in my career, I use Trade Station, but I moved across to AmiBroker when I started trading equities.
I liked the platform, it’s pretty simple to use. It gives you a blank piece of paper, a blank slate, and it does exceptionally good on portfolio testing across many universes of stocks.
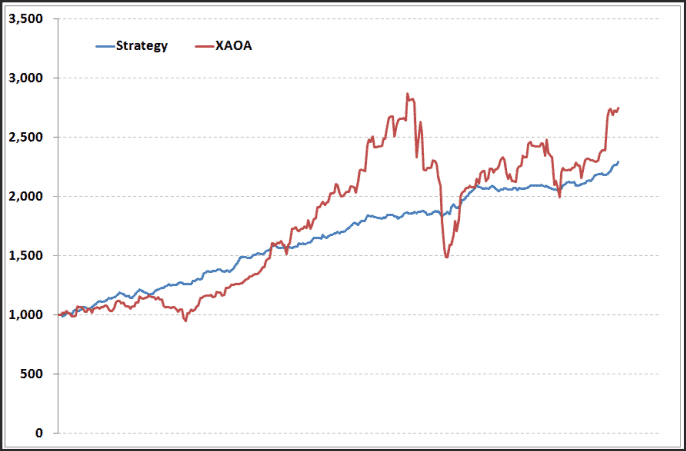
So what we’ve done here is put the rules into the system back to the year 2000 and we’ve tested it on the top 500 Australian stocks, which is the all Ords accumulation index:
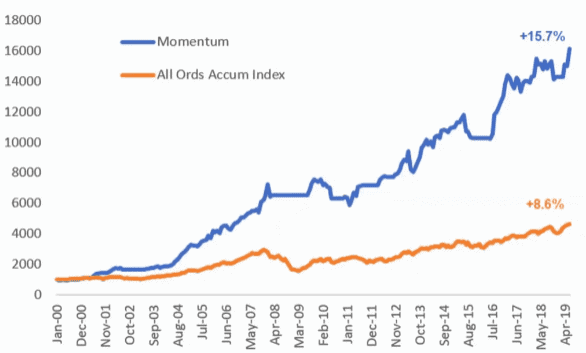
And you can see here, if you would follow these rules over that period of time for the last 20 years, you would have had a return of 15.7% versus buying a whole of 8.6%.
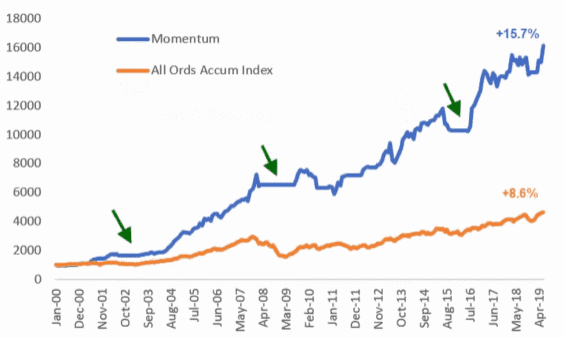
And you can see in 2008 and 2009 the portfolio flattens and this is exactly what my portfolio does. I just sat in cash for that whole period of time. No pain, no nerves. Just able to sit there.
There are 2 important upsides for that. First of all. You don’t lose money. That’s always a good thing. I haven’t met too many people that enjoyed losing 30%, 40% of their money that they had in mutual funds.
Yes, some of those mutual funds came good again, but that was a very uncomfortable period of time. Now, don’t get me wrong. I lost money in 2008 and some of my portfolios, one was 13%, others I lost nothing.
That put me in a very strong financial position, which in turn put me in a very strong psychological position to pull the trigger again in 2009 when the market started going up.
Now a lot of people that lost a lot of money back in the GFC, even today, 10 years later, they cannot get involved. They’re too scared to get involved because they’ve lost so much money.
If you have a mechanism to protect the downside, you’re going to be more able to get involved and make money when the market’s running up.
So you can see here on the Australian market, it looks pretty good in terms of return. Don’t get me wrong, we’re not hitting the baseball out of the park. That’s what I’m not about.
If you were coming here expecting to make 200% per year returns or 15%, 20% monthly returns, that’s not what I’m about.
When you’re trading 6 ,7 figures, you just want to chip away with good returns like this over the longer term, and compounding will do its thing.
So the other thing we get from putting this data or generating this data is not only we can see the equity growth, we can see the drawdowns, we can see exposure, we can even go down to sector exposure, all that kind of stuff. I can give you all sorts of statistics.
For example, I can tell you. That this strategy is only ever had three losing years since 2000 it makes money in 75.2% of all months.
The average losing month is 2.9%, the average winning month is 3.8% and the maximum amount of losing months in a row is 4. So with that information, you can arm yourself and have confidence that.
You know, one of the things I see is people start my strategies and they have two losing months and they say, Nick, this is not going very well. Maybe I should go and do something else.
If you know there’s a chance of having four losing months in a row, well you’re in a better position to just hang out and just let it do its thing.
But when you’re trading discretionarily you can’t actually do that because you don’t know. There is no solid evidence of what can and cannot happen. The most important thing, believe it or not, is the drawdown.
So with a drawdown, that’s how much your account will decline at any given point of time. Every single strategy on the planet has some kind of a drawdown at some stage.
There will always be a drawdown
If you’re Warren Buffett, if you’re Jim Simons, whoever you may be, the Turtles, whatever, you’re always going to have a drawdown.
It’s always going to be a drawdown. Someone told you that I don’t have a drawdown. Well, sorry. They’re bullshitting to you. They’re absolutely lying.
So this is a fact of trading that at some stage you’re going to have an uncomfortable period of losing money. And what differentiates a professional trader like me from an amateur is that I expect it’s going to happen.
I’m ready for it when it happens, and I allow it to happen without changing strategy. And I see through the other side.
So here again is the same strategy on the same market, the ASX, and you can see here that the strategy has a drawdown of 22.1%:
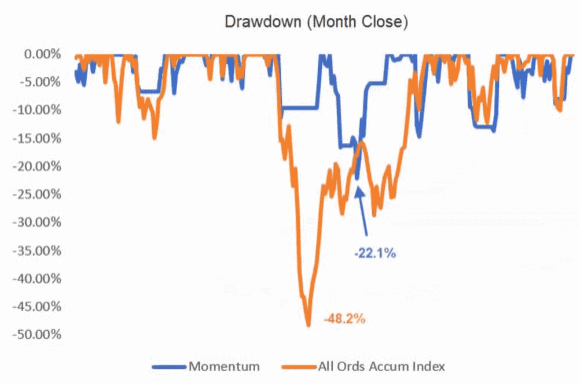
Some of you may think, oh that’s pretty extreme.
Well, when you compare it to buy and hold, it’s less than half. So it is a lot better than buying and holding.
Don’t forget we had a return that almost was as twice as good. So when we look at risk-adjusted return, the strategy is significantly better than buying hold. I’m not saying it’s not painless. There is some pain involved.
There’s always pain involved with good things, but you’ve got to get through it. It’s no different than going to the gym or losing weight. There are uncomfortable periods of time, and it’s the same with trading.
Here are the periods of time where the positions go into cash.
Now, I haven’t added any interest into these equations, so in actual fact, you would get a little bit of return on your money from earning interest, or you could put it into a bond ETF or something like that.
Now, this portfolio is only been invested 70% of the time, and it will sit through extended bear markets and don’t get me wrong, that can be difficult for some people.
When we started our service back in 2006 some of our investors in 2008 wanted to know why we’re sitting in cash. Why are we paying you?
We’re doing nothing. It was only until the end of the GFC when the market tanked so far that they realize the benefits of actually doing that and obviously that they’re pretty happy about it.
So for some people, it can be quite frustrating sitting there doing nothing. And for a lot of people, you want to be busy, you want to be doing stuff, but sometimes doing nothing is the right thing to do.
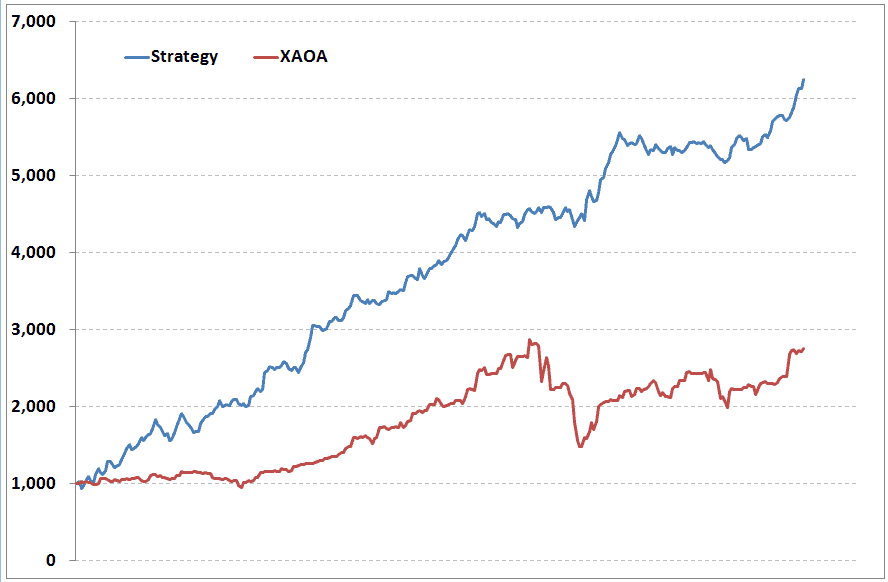
So let’s put the same strategy, the exact same rules on the S&P 500 200-day rate of change, and there we go:
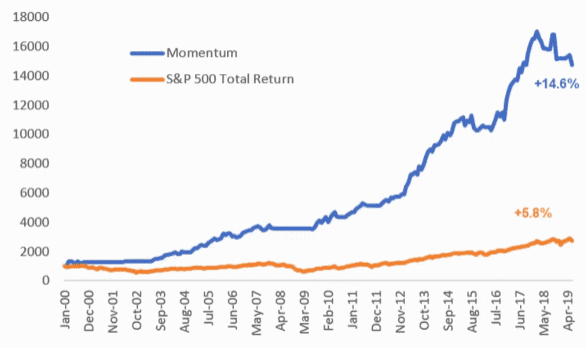
We’ve got a 14.6% return compared to buy and hold return of 5.8%.
Now when you put the strategy in a completely different market and you get a good result, you know the strategy is robust.
When we look at the drawdowns. You can see here that the S&P 500 had a drawdown of over 50% during 2008.
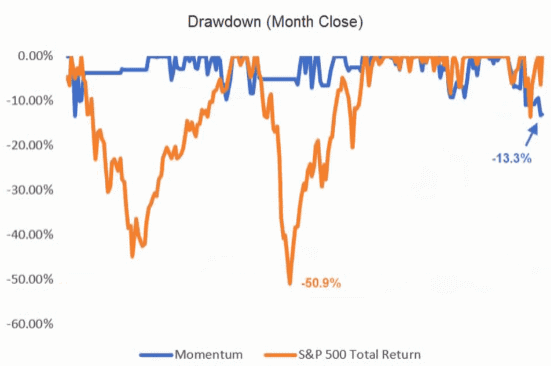
This strategy and this is real data, is going through this current drawdown. At the moment, we’re down around 13.3%. Not nice, but it happens. That was mainly due to the fourth quarter last year where we had that big route.
I was out of the market in December, but I was in the market in November when there was a big rotation out of momentum stocks, and yeah, I’ve got knocked around quite a bit but that’s life. That happens.
If you trade long enough, you’re going to get a smack around the face by Mr Market to tell you to show a bit of humility.
So you just got to take it easy with the risk. That’s all. So we’ve got the same strategy in two totally different markets, and we’re seeing some pretty good results across the board. Now that’s called robustness.
Comparing robustness
But I want to show you robustness in a different way. Bear with me here.
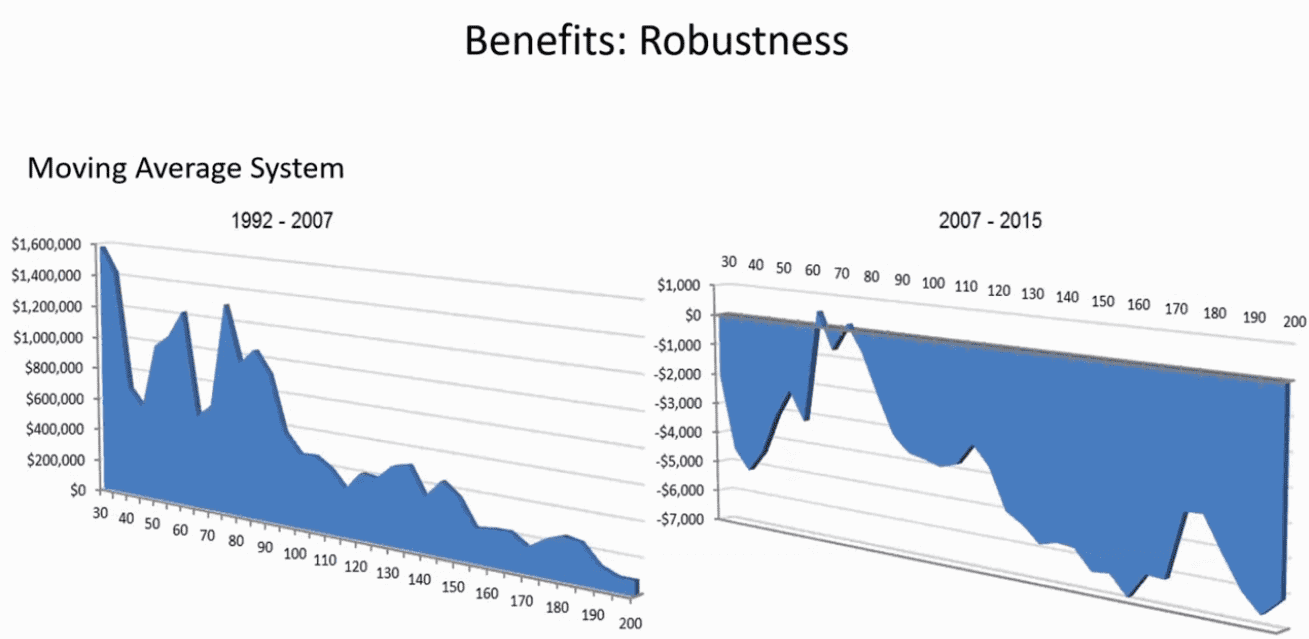
What we’ve got here is a simple moving average crossover strategy and we test that strategy in 2 different periods of time. 1992 through to 2007, then from 2007 through to 2015. And we look at crossovers between 30 and 200 days.
Now on the left of this chart, 1992 to 2007 you can see all those are profitable. It’s not particularly good looking. It’s a little bit lumpy there, especially around that 40, 50, 60 areas at the start, and then it fades on out. Now that’s not particularly robust.
In other words, if the market changes character, which the markets always do over time, then you might find that if you use a 50-day crossover or 50-day breakout, which has been really good in the past, it might not work very, very well into the future.
If we look at the same numbers between 2007 and 2015 you can see almost every single parameter is actually a losing proposition.
So what was reasonably okay between 1992 and 2007 has not worked since 2007 in any way, shape or form. In other words, what I’m saying is. A very basic moving average crossover system is not particularly robust.
Now let’s compare that with our momentum model.
Here you can see 1992 to 2007 and what we’re doing here is looking at the lookback periods we talked about. In our model, we used a 200-day look back, but here we test every look back period from 50 days out to 300.
And we do that between 1992 and 2007 and then again between 2007 and 2015.
The big difference here is you can see the both of them are very, very profitable. Regardless if we use 50 days, 100 days, or even 260 days, they’re all profitable.
And that’s what’s important because what happens over time, markets slightly change. A good example of that is the turtles. We all know that the turtles used to trade a 220-day breakout back in the day, back in the seventies and eighties but today there are still a few turtles out there trading.
They use much longer-term breakouts. So over time. I have slowly adjusted to the markets changing their personality. So you can see here the benefits of this robust type of strategy that if the market changes over time, you are still going to be making money.
We’re almost at the end, let’s have a look at some pros and cons of using momentum.
Pros of using momentum
It’s been validated by very extensive and potent academic research. There’s a ton of white papers out, if you want to hear from some, just drop me an email. I’m happy to pass it on.
There are several books out there:
- Stocks On The Move by Andres Clenow
- Dual Momentum by Gary Antonacci
- Relative Strength Strategies for Investing by Meb Faber
There’s a lot of them out there. Take a read of them. They’re very, very good. Momentum keeps you invested in the strongest markets or the strongest sectors or the strongest stocks without you having to even think about it.
You don’t have to predict what’s down the track. You’re automatically going to be in the strongest stocks full stop.
And a good way to think about that, this may sound like a pretty dumb kind of statement, but let’s just say at the end of 2020, in one year’s time. Let’s say gold is going to be a $10,000 how many gold stocks would you want in your portfolio? Would you want one? Would you want as many as you could get?
Or would you like some bank stocks in there as well and some agricultural stocks and that kind of stuff? Well, if you knew for certain that gold was going to be 10,000 bucks, you’d want to be all in.
You want your whole account in gold stocks because that’s the way you’re going to make the maximum amount of money.
So what I’m saying here. If you stay invested in the strongest markets without having to predict, you’re always going to be sort of ahead of the game.
These kinds of strategies reduce your exposure to sustain bear markets. We’ve seen what happens and take you out of unfavourable sectors as well.
If gold goes down for the next year, then you’re not going to be buying gold stocks. You don’t want to be buying gold stocks. If gold is going down, you can’t make money buying gold stocks if gold is going down.
So this will automatically reduce your exposure to any sector or any stock that’s going down.
Remember, one of our rules was the stock had to be trending up. It’s completely systematic and I’d like to say non-emotional. I certainly can have a few sleepless nights.
November 2016 election with Trump was a very sleepless night for me, fully exposed, with S&P 500 moving down. Who knows, that could have completely gone the other way.
So the portfolio and volatility dynamically adjusts and rebalances and it’s minimal workload. Now, I’ve said half a day, a month, or half a day, a quarter. Well, I’m lying.
I’m probably spending probably on these particular models, maybe half an hour, not half a day, once a month. Literally half an hour.
Obviously, there are 30 years of research and development going into that stuff, but hopefully, you know, with what you’ve seen today, you can fast track your way through that a little better than what I have.
Cons of using momentum
But let’s have a look at some of the things that are difficult. First of all, buying strength.
It’s quite difficult for a lot of the average punter out there. Buying strength and then selling when a stock goes down tends to be a little unnatural sometimes, and this year is actually one of those times it can underperform.
I’m underperforming the S&P 500 this year. It’s the first time in about 10 years I’ve underperformed. There are a couple of reasons for that.
If we look back to January this year, remember Q4 last year, we had a big tank. The market tanked and all went into cash and the market didn’t tweak to my bullish trend until March.
So the market really started almost rallying from January the first, it rallied very hard in January, February, and March. And I only got involved in March, so I was actually sitting out for a lot of this year’s returns in those first two or three months.
Also, it can be commissioned sensitive. I use a deep discount broker in the US and I know you’re going to ask the questions. So I’ll tell you who I use. I use Interactive Brokers, for all my active strategies, both, both here in Australia and in the US.
So depending on the broker that you use, and depending on the rebalancing, it can be a little bit commission sensitive.
The average hold period tends to be about 3 times the rebalance. So what that means, if you’re rebalancing every month, then your average hold period will tend to be roughly three or four months.
Tax
Now that means that you may have tax considerations that you have to take into account. There can be arguments, especially from traditional accountants, saying you’ve got to hold for 12 months to get down that tax.
Well, I don’t agree with that. I look at tax like advertising in a business. If you advertise in your business and it adds value to your bottom line, or why wouldn’t you advertise?
Yes, it’s an expense, but it’s adding value to your bottom line. If you have an active strategy here, let’s say making double the market return and it’s taking you, half an hour once a month. Well, it’s probably in your best interest to keep going with that. There are also vehicles that enable you to decrease your tax.
![]()