Dollar Cost Averaging
Dollar Cost Averaging
Dollar Cost Averaging (DCA) is the process of buying shares at regular intervals with purchases made regardless of price fluctuations of the asset. The usual process is that a small percentage of one’s salary is set aside to invest each week, month or quarter.
DCA is often put forward as a valid variant of a Buy and Hold strategy. It stems from the belief that market timing is sub-optimal, if not impossible. That’s a discussion for another time.
Theoretically, DCA is designed to reduce the impact of volatility of the overall purchase by averaging out the cost basis, and to remove the need to time the market. In theory one will buy more units at lower prices, and less units at higher prices.
Interestingly, whilst compiling this material, my local newspaper ran an article on this exact topic written by a very well-known financial commentator. He highlighted the merits of the approach.
The Chartist
Here at The Chartist we’ve certainly seen a jump in enquiries from first time investors wanting to get involved. Alan Kohler also highlighted the jump in Google searches for “How To Buy Stocks”.
Let’s put it to the test.
Individual company risk is a big factor in investment decisions in this environment, so we’ll stick with a broader market ETF, namely the Australian ASX-200 ETF (STW) that tracks the S&P/ASX 200 index. As at writing the dividend yield is 5.55%.
We’ll start with an initial investment of $1000 and then allocate another $1000 each month for the duration of the test. The start date is January 1 2002 which is just after the ETF was listed.
There are no commissions included and no exits.
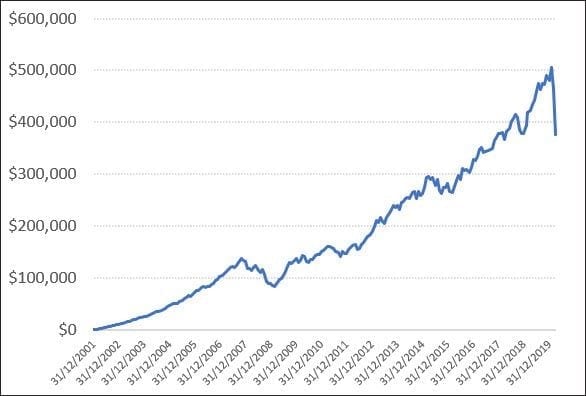
The compound annual growth rate (CAGR) is 4.66%.
Had we started at the absolute worst time, with hindsight, the CAGR drops to 2.62%.
Had we started at the absolute best time, with perfect hindsight, the CAGR jumps to 8.00%.
Here’s a different spin. Let’s say you’re interested in entering the market for the first time. Currently the market is -25% from its all-time highs.
What would the CAGR be had we started investing the last time the market was 25% from its all-time high, which was September 2008?
5.40%
That’s better than money sitting in a bank account.
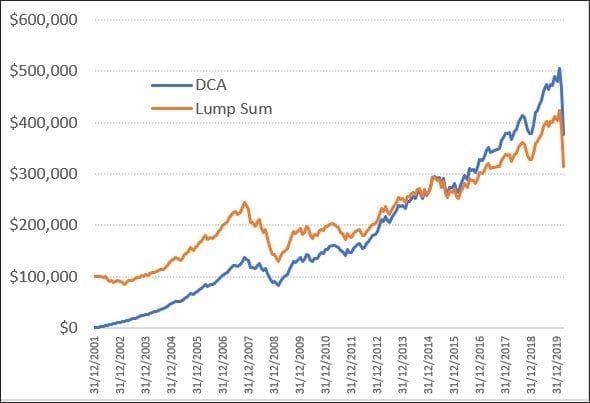
Next, let’s compare a single lump sum investment of $100,000 at the same start date vs starting with $1000 and making monthly $1000 contributions.
Some food for thought.
Pro Tip: When making smaller contributions, ensure the commission cost is not out of proportion to the investment amount. If it exceeds 1.5% then it would be wise to invest only when the contribution amount is higher, i.e. if you can only afford $500 per month, then perhaps invest $1000 every second month instead.
![]()
Craig Fisher
Portfolio Analyst and Mentor