
Trading with Seasonality
Trading with Seasonality
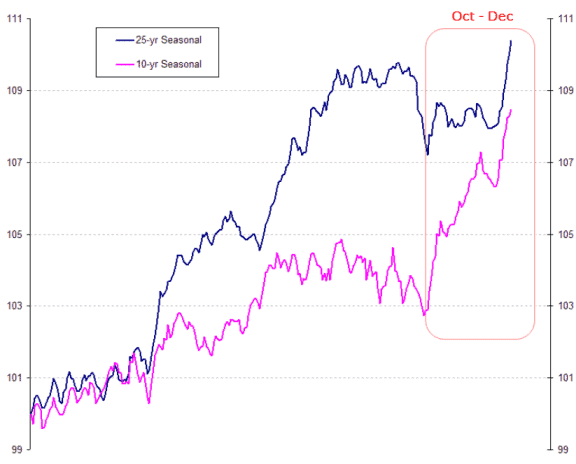
In the prior article we discussed the concept of seasonality. I’m now going to expand on that to show how it can be used in the real world using a systematic approach. The following chart shows the seasonal tendencies of the XAO over 25-year and 10-year time frames. Whilst there are several strong seasonal movements, both up and down, the most powerful is the late October to year end rally and this will be our focus for this example.
Season 3
26.5% of the XAO capitalization is made up of just 5 stocks; BHP and the 4 major Banks. These 5 will be our proxy for trading the index but any instrument could be used in their place.
Just because a seasonal pattern exists, one should not just jump right on in and buy for the heck of it. What we’ll do here is build some simple, yet robust, rules to participate in this type of trade. Robust is very important. The more you attempt to fit the particular stock the data, the lower the chances of the system working in the future. It’s always best to have a few simple rules that are applied equally to each stock to create reasonable profitability, rather than applied a mass of varied and individual rules to try and create spectacular performance.
First and foremost, the basis of seasonality, in this case anyway, is the time of the year. We note that from about October 23 through to year end the XAO tends to show distinct strength. Our first rule for the computer is to define when to start looking for the seasonal strength. I have therefore asked the computer to start its analysis in October and more specifically from the 21st.
Rule #2
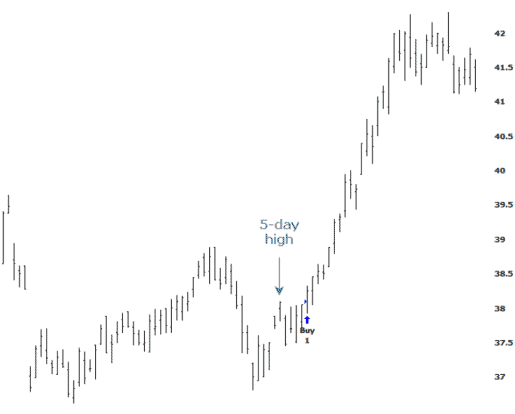
Rule #2 is required to ensure the stock is at least moving in the desired direction before we board the trend. The simplest way to do this is tell the computer to BUY if the stock starts advancing above the highest price set over the preceding week or two. This will ensure that we don’t enter into a downtrend that may continue lower. At least some semblance of strength may indicate that the anticipated seasonal bias is beginning.
This method is known as a “channel breakout” and it’s a simple yet effective way to enter trends. Therefore, I will wait for the 21st of October, then, when the highest price of the preceding 5-days is breached, I will enter a long position. There is no secret with 5-days. The lower the number the more noise you will encounter. The higher the number the less noise, but the more trend you may miss, especially when we’re looking at a small window. It’s a balancing act. A conservative trader may use a higher number, such as 15, although I would not go below 5-days. The important element is that you use the same number for each and every stock and not attempt to find the best fit for each stock.
The following chart of CBA shows prices moving above the 5-day high after the 21st of October.
Season 4
Entries aside we need to manage the trade from an initial risk protection mechanism and then a profit taking mechanism.
Again, to keep things simple and robust I have told the computer to exit any position should the stock price drop by 10% after entry. Now this is an area where some further tinkering could be done. Each stock operates at different volatility levels, so a 10% stop in BHP is probably a good idea, yet WBC may be a little too wide. So rule #3 for this test is a 10% protective stop loss.
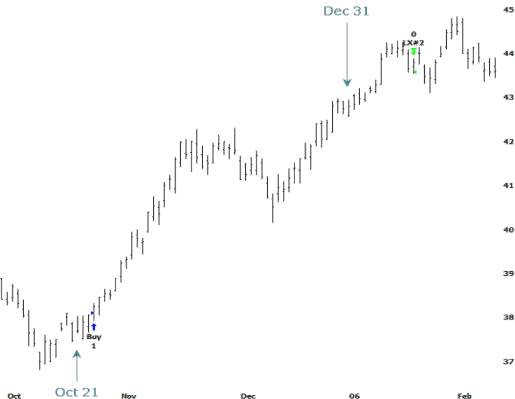
Lastly we need a rule to exit the position. We know that the seasonal strength lasts until the end of December, but if a trend is strong we don’t wish to just exit for the sake of it. Therefore, I have said to the computer that it’s to exit after December 25th using the same technique as the entry; that is, exit when the lowest price of the preceding 5-days has been breached. If a strong trend is prevailing then we can extend the profits a little further. Here is a completed trade:
Season 5
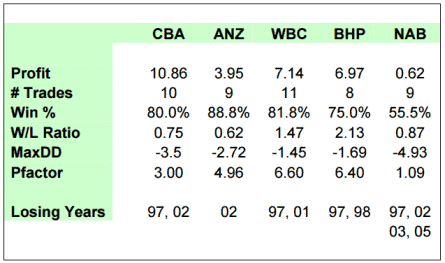
Let’s take a look at the results for the 5 stocks from 1996 onward.
Season 6
The system works profitably across all stocks, although NAB is certainly an underperformer with 4 losing years compared to the standard of 2 losing years for the others. The sample is considered small for each individual stock, but because the inputs are robust enough, we can combine the complete set to get a clearer idea of what to expect.
What about the impact of dividends? Essentially these are seasonal events, so what influence do they have on the share price? Here we test CBA for the same 10-year period since 1996 where the stock goes ex-dividend on the June 31 and December 31. So I did the following:
Asked the computer to buy at the start of June and December and exit at the end of each month before the ex-dividend date. I didn’t ask for a move above the 5-day high though or did I set a protective stop; What I wanted to see was any natural seasonal pattern that may exist.
Here are the results for CBA:
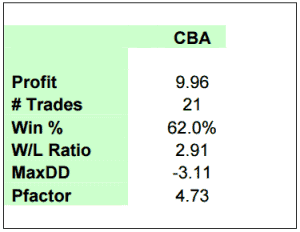
Season 7
This shows a clear bias for the period that the share price of CBA will increase running into the ex-dividend date and that the bias is significant enough to make it a worthy seasonal strategy. Using some further small tweaks could improve the numbers considerably.
![]()