
Diluting Signal Luck
As I’ve mentioned in a few of my recent video’s, now is a good to reflect, not only on life in general but also on your trading.
What could I have done better?
Am I missing anything?
Are there risks I’m not seeing?
The market will always keep you humble. It seemingly gives you a slap across the face if you’re not paying attention.
So here’s something that I have been thinking about but maybe have been approaching it from the wrong angle. And thanks to Corey Hoffstein over at investment firm Newfound Research LLC I’ve had a jolt of common sense. I’ll link to some of Corey’s excellent research below.
To gain diversification when trading serially correlated instruments, specifically stocks, I have always used a variety of systems across markets and time frames. These include absolute trend, relative momentum, mean reversion, volatility day trading and I’m currently researching a market neutral strategy.
Yet within some of those specific strategies lurks another risk; signal luck.
Let me give you a basic example.
Here the US Trade Long Term is an aggressive monthly rotational momentum strategy. This means it assesses the market and individual stocks once a month and makes a decision whether to remain invested or head to cash.
That portfolio looked at the market at the close of February and decided it was time to go to cash. In hindsight a good decision. The portfolio is -2.5% YTD and in a drawdown circa 15%.
But what if we hadn’t exited? What if the strategy had been slightly slower to react and left us holding the portfolio during this downdraft? Well, we’d be -16.6% YTD and in a drawdown of nearer -40%. Not pleasant.
And that’s signal risk or timing luck as Corey calls it. Here’s some further reading:
The Dumb (Timing) Luck of Smart Beta
So what can we do to dilute signal luck?
From my immediate research we can do at least two things; vary the sensitivity of the rebalance and vary the sensitivity of the regime filter lookback.
For this exercise we’ll compare the current monthly portfolio with a weekly variant that also has its regime filter halved, i.e. if the regime filter was set to 200 days in the monthly we’ll adjust it to 100 on the weekly.
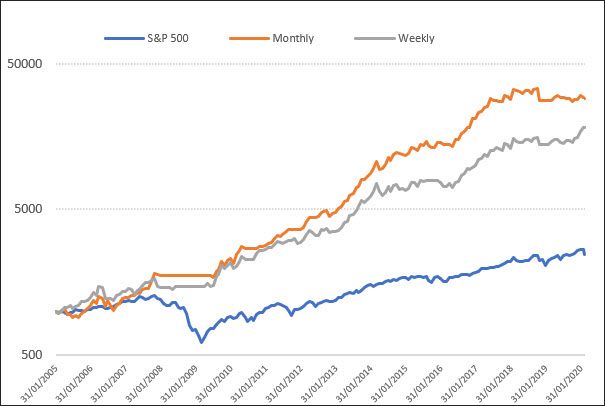
The CAGR drops from 24.8% to 21.2%. The maxDD is more or less exactly the same so the MAR drops from 1.26 to 1.07. However, the K-Ratio, or smoothness of equity growth is superior on the weekly version.
Next we’ll divide the portfolio into 50/50, specifically we’ll place 50% of the funds into the monthly rotation and the other 50 into the weekly. In this way we’ll be diversifying the signal and the rebalancing.
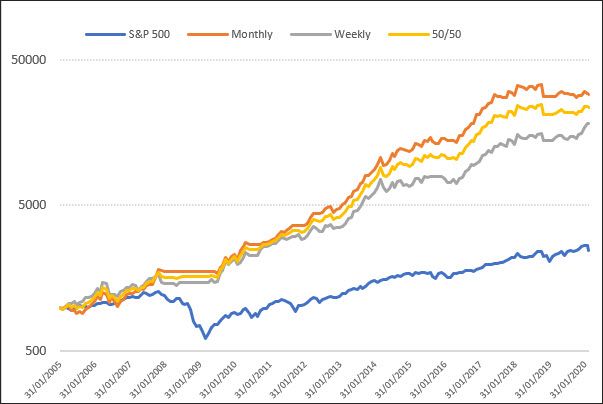
The CAGR of the combined portfolio moves higher to 23.2% and the drawdown now stands at -19.1%. The K-Ratio declines a little and is on par with the S&P 500.
Whilst executing monthly was designed to lower workload and trading frictions, adding a weekly variant lowers the risks of signal luck considerably without diluting returns a great deal. Being a concentrated portfolio trading frictions remain minimal.
I feel this has been a worthwhile exercise considering ‘what could have been’ and I’ll personally be looking to implement it.
Take care out there. Use your isolation productively.