Recency Bias – Using a Recent Sample to Draw Conclusions
“The great strategy you can’t stick with is obviously vastly inferior to the very good strategy you can stick with.”
That’s a great quote. Why?
Too often aspiring traders look for the greatest strategy. Instead, it would be better to look for a reasonably good one and applying it for the long term.
But here’s the thing. During certain short windows of time, the performance and metrics of every strategy will fluctuate, simply due to market conditions within those windows.
You may have a system that offers a 65% win rate of trades, but in small windows it may drop to 40%. You may have a system that shows an 18% annual return over 25-years, yet in some windows this may decline to 5%.
This is important because most new or inexperienced traders tend to suffer from Recency Bias.
Recency Bias Explained
Recency Bias occurs when a small or recent sample of trades is used to draw bigger picture conclusions.
If a trader has 5 losing trades in a row immediately after starting a new strategy, they may think the strategy has no merit. They may tweak and make adjustments. They may abandon it altogether. Simply put, when we look at a long term equity growth chart, one that trends very nicely, what we don’t see are the short term hiccups the system endures.
Consider the two equity growth charts below, both from the same strategy.
The chart on the left shows a 1500 trade sample of the strategy. It would be reasonable to suggest that most new traders would be enticed to start trading this strategy.
Yet what they don’t see within this larger sample is what happens in the short term windows. The short term is shown on the right. This 25 trade sample shows a window that doesn’t look overly enticing. Indeed it looks quite ugly and would be discarded by 95% of new or inexperienced traders.
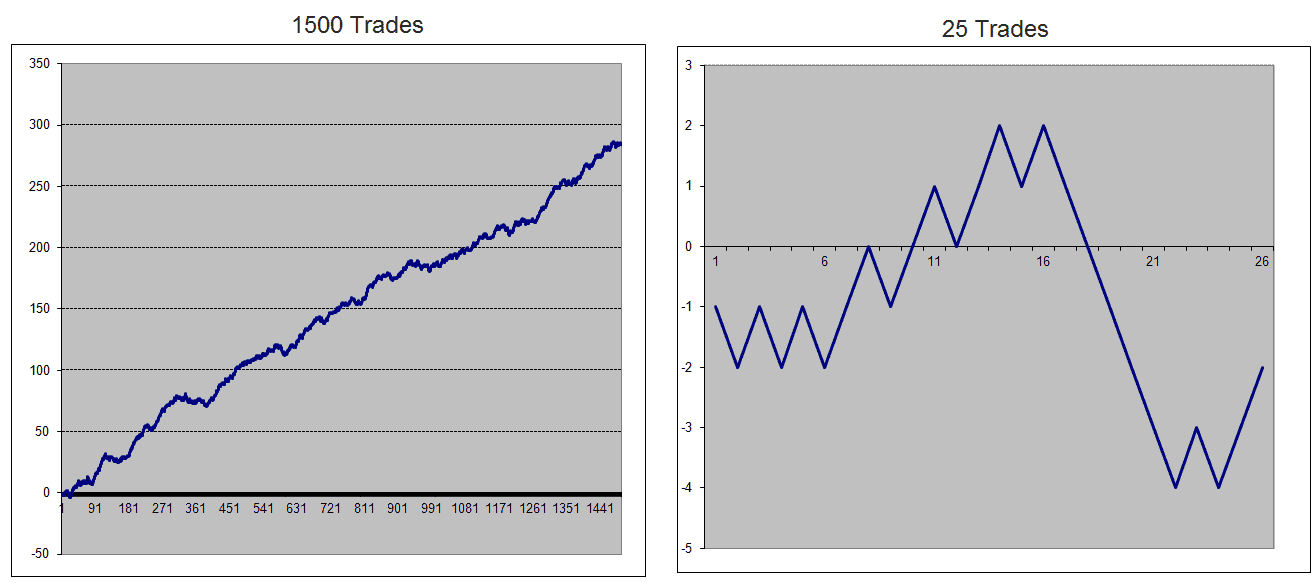
You cannot achieve the long term performance shown on the left without riding the short term ups and downs shown on the right.
Another way to stay the course is to ask, “What’s the probability of making money in any given window of time?”
How Long Should You Run a Strategy?
Most people put a time limit on the application of a strategy. They may say, “I’ll give it a go for 3 months and if I haven’t made money I’ll go elsewhere“.
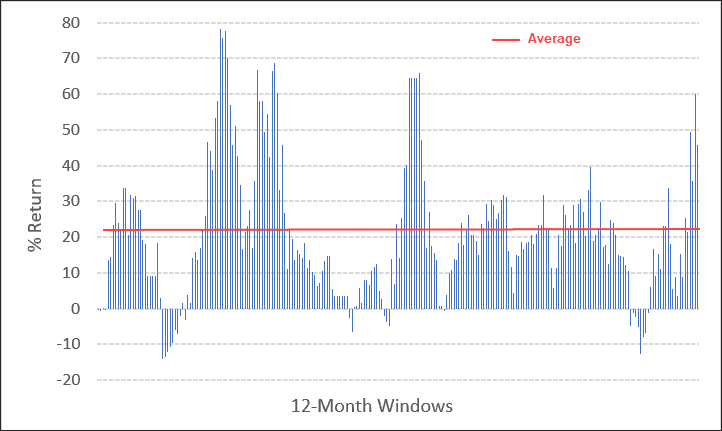
Rather than use some random period, why not base the decision on fact? For example, below is the 12-month rolling returns for our ASX Momentum Portfolio using 1-month intervals.
While the long-term average annual return is 22%, it can be clearly seen that there are excellent 12-month periods, and a few not-so-excellent windows.
If you’re a ‘cup half empty’ type of person, over the last 20-years, there has been a 10% chance of losing money in any 12-month time period. Since 2005, this dropped to just 6%.
Or, if you’re a ‘cup half full’ person, think about it like this; If I stick with this strategy for at least 12-months, I have a 90% chance of making money.
Considering 90% of people lose money, that’s a good reason to take a moderately good strategy and apply it over the long term.
![]()
P.S. The ASX Momentum Portfolio is perfect for new or inexperienced investors. It trades once a month, requires minimal work and can be executed via any broker (we use SelfWealth). Better still, have the confidence to trade it right alongside Nick & Trish Radge.