Diluting Signal Luck – Real Time Data
After the COVID crash in March 2020 I wrote a reflective article on lessons learned and what could we do better. The key takeaway for me was diluting signal luck.
As mentioned at the end of that article, I implemented this new tactic as soon as the Trade Long Term Portfolio switched back on, which it did on June 1st 2020. As such, we now have about 18 months of real-time data to assess.
Let’s see what we’ve discovered.
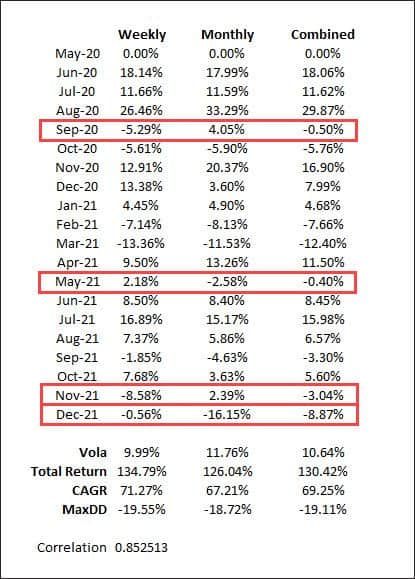
The table below are my personal performance results since we initiated the weekly rotation.
*Important caveat: the above data is based on month end marked-to-market valuations. Intra month equity swings may therefore be under or over-compensated for.
Both the weekly and monthly portfolios have returned, more or less, the same profit for the period. We do know from historical testing that the monthly version has a slightly better longer term return. However, absolute return was not the aim of this exercise.
I have highlighted a few months where we did get the benefit of diversification, with one offsetting the other.
In summary the goal was to continue to dilute risk, whether that be across markets, time frames or even certain parts of individual markets. Risk also lurks below with signal luck. While we’ve not seen a March 2020 COVID crash in this data sample, month-to-date December 2021 has certainly been a tale of two very different data points.
Food for thought.
That’s it for me for 2021. It’s been a bit of a roller coaster ride this year after a bumper 2020, but that’s why we take the long term view and focus on the next 1000 trades.
I’ll do my usual yearly report card early in the New Year.
![]()