
Trading With Divergence
The world of technical analysis is saturated with indicators, oscillators, lines and other weird and wonderful esoteric attempts at finding the Holy Grail. However there are really only three absolutes; price, volume and time. These items, coupled with patience and a level head for creating positive expectancy, enable us to be successful trading the market.
Divergence is a useful indicator, or method, to identify and trade trend reversal moves. Divergence occurs when price moves in one direction and the indicator starts moving in the opposite direction. There are three published versions of divergence known as Type-A, -B and –C. discussed by Dr Alexander Elder in his best seller, Trading for a Living. As the Type-A setup is the most powerful it’s the only one that makes an appearance in our Playbook.
There are a number of indicators used to identify divergence including the MACD, RSI, Williams %R and Stochastic. The trick is to pick one indicator and stay with it and not be tempted to chop and change. Most indicators are used incorrectly and thus they tend to be futile when used in the real world. In my, Swing Trading video I outline divergence as the only setup that uses an indicator and the indicator of my choice is the Stochastic.
The Stochastic (Slow) indicator calculates the location of a current price in relation to its range over a period of bars. The default settings are the most recent 14 bars, the high and low of that period to establish a range and the close as the current price. This calculation is then indexed, smoothed and plotted as SlowK. A smoothed average of SlowK, known as SlowD, is also plotted. SlowK and SlowD plot as oscillators with values from 0 to 100. The direction of the Stochastics should confirm price movement.
The following chart shows a Type-A Bearish Divergence on the daily chart of Medusa Mining (MML). Prices probe higher but the indicator fails to make a secondary higher high:
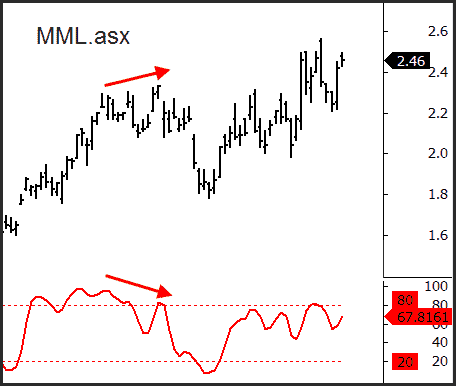
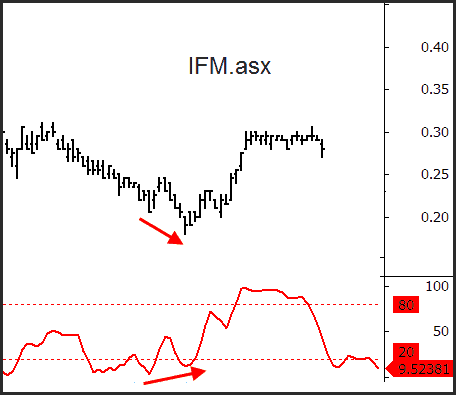
They key to trading divergence is that it must be obvious. If you need to look closely at the chart to measure it, then it’s probably best to stand aside and await a very clear example. When a divergence is in place we expect that prices have stretched too far to continue, and either must (a) consolidate for a period of time, or (b) snap back against the momentum. When we trade the setups we’re looking for the latter to profit. Infomedia (IFM) offers a Type-A Bullish Setup whereby prices make a new low, but the Stochastic fails to confirm by making a higher low. Note how prices snapped back in the coming weeks.
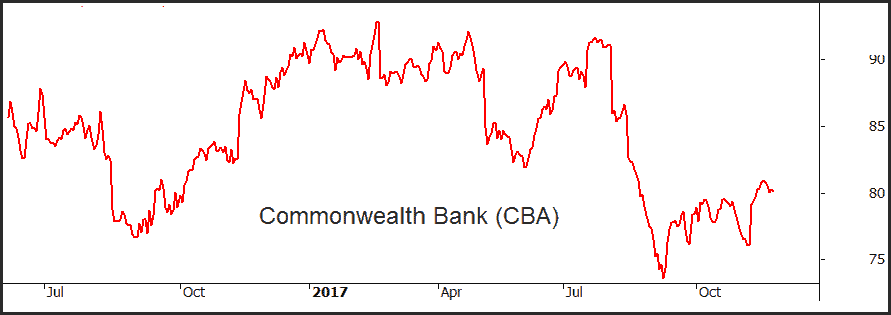
Being a reversal pattern these divergences will be found predominantly against the trend of the broader market. If you’re new to trading, or looking for a ‘higher probability’ outcome, then it’s always best to trade aligned with that broader market trend rather than against it. This is very easily spotted and done using our short term trend filter discussed in another article. The following chart shows Commonwealth Bank (CBA) trending nicely higher. However the Index Filter switches from bullish (green) to bearish (red) coinciding with a Type-A Bearish Divergence setup. Over the coming weeks the share price declines almost 10%.
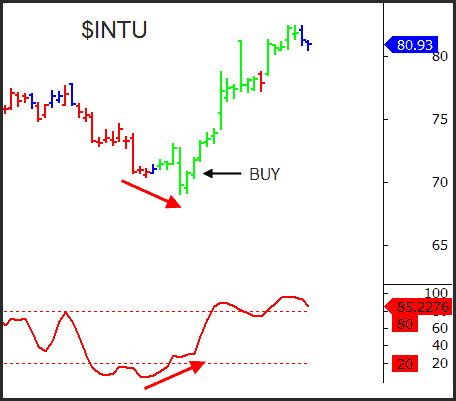
Our last example shows a Type-A Bullish setup for Intuit Inc ($INTU). Prices had been falling in alignment with the $SPX trend, but once that started turning higher $INTU had a quick spike to new lows to form the setup and then started a new bullish swing surpassing prior highs.
In the next article we’ll discuss an entry technique for any setup that will dramatically boost the risk/reward potential for your trades.
Why not try our 2-week trial which offers you full access to all our services, including:
– short term portfolios for both the ASX and US markets,
– the Growth Portfolio for active investors and SMSF Trustees,
– technical research on Australia’s top stocks and global markets such as Gold, S&P 500, Iron Ore and others,
– exclusive member-only educational content.
![]()