Like a Casino: Ramping up the Profits
If you are genuinely interested in improving your trading results let’s head back to the casino (metaphorically!).
The casino has another little trick up its sleeve that we can learn from. Previously we’ve pointed out that the casino let’s everyone play – the more people who play the more opportunity the casino has to exploit their mathematical edge.
When you walk into the Sydney Star Casino* there is something missing. All the flashy lights, glitz, glamour and razzmatazz are there. Yet something, or more specifically, someone, is missing.
The croupiers.
There is a distinct lack of them. Sure, there are a few around, but more and more of the games are being operated by computers rather than humans.
Why?
There are two ways to increase profitability; increase your edge (which usually means taking on more risk) or increasing the rate of exploiting your edge.
At the casino a computer with credit cards inserted can process the dealing and monetary transactions a lot faster than a croupier can manually. This increases the rate of play which, in turn, increases the frequency at which the casino can exploit its edge. If they have a 5% edge on 50 hands in an hour, they can increase their profit simply by playing more hands in that hour. If the computers can double the number of hands being played each hour, they double the casino’s profit.
Croupiers: exit stage left.
When we talk about an edge or positive expectancy in trading we are referring to the ability of a strategy to make profits. That’s always a good starting point – everyone wants to make a profit. However, the extent of those profits is influenced by the trade frequency.
I recently read a comment about a trade setup in Commonwealth Bank which has been profitable every year for the last 15-years. Sounds great. However, apart from sample size issues, the problem is the setup only makes one trade a year. Nobody is going to get rich making one trade a year, unless they dramatically up the ante and bet your house on it.
Let’s consider two strategies both of which have a positive expectancy.
Strategy-A has a winning percentage of 46% and a W/L ratio of 2.43. Sounds very similar to a nice trend following system – which it is. So every 100 trades will make 57.78 units of profit. Perfect.
Strategy-B on the other hand has a winning percentage of 64.2% with a W/L ratio of just 1.01. Fits the profile of a short term system – which it is. For every 100 trades it generates 29.04 units of profit. Hmmm…not so perfect – it’s half the profit of Strategy-A.
Which would you choose?
If you chose Strategy-A you may need to know it actually only makes 50 trades each year, so its units of profit per year is 28.89. Strategy-B on the other hand actually makes 200 trades per year, meaning its yearly profit is 58.08 units.
The trade frequency of Strategy-B is the driver that makes it twice as profitable as Strategy-A in any given year.
Imagine if you could take Strategy-B up to 400 trades a year?
Profits double again.
800?
Food for thought…
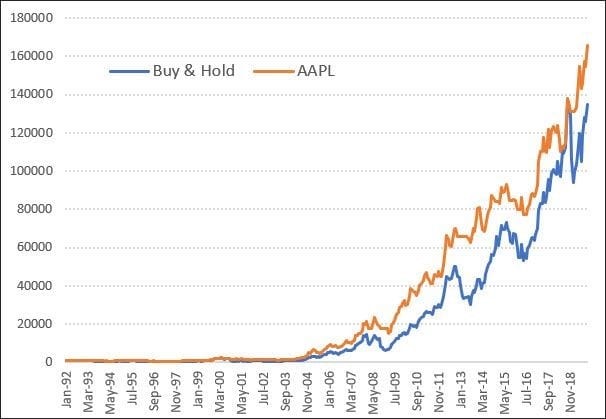
P.S. – With the US market on a good run recently our US Systematic Power Setups® offer extremely good diversification to other Australian strategies.
Learn to make a second income via our US Power Setups®
* We don’t gamble. A casino is purely being used as an example.