Trading and Hindsight Bias – Part 2
Hindsight Bias
Previously, I discussed Hindsight Bias. You can read that article HERE.
The conclusion?
We can’t know what the future holds for a single stock. Basing a complete strategy on an individual stock that has been cherry-picked from past performance may be risky.
The solution is to better understand the robustness of the strategy itself. To do that it should be tested over a larger universe of symbols.
To recap here’s the suggested strategy highlighted in last weeks article:
“This trend trading strategy signals to go long when the 10 day EMA crosses and closes over the 50 day EMA and to go back to cash when the 10 day EMA crosses under and closes below the 50 day EMA.“
Next I’ll run a basic test across every stock in the S&P 500. Each position will be allocated $1000 and every possible trade taken. The idea here is to view how the strategy performs across many individual stocks.
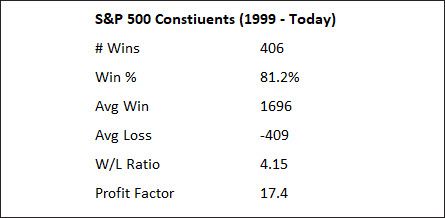
Some very impressive numbers.
406 (81%) constituents show a profit after 20-years of trading. The average winning stock makes over 4x the average losing stock.
The following table shows that AAPL is not the most profitable during the period. It comes in at #5.
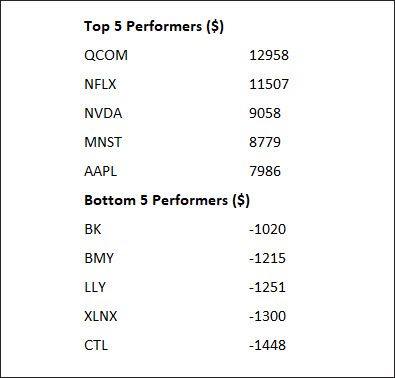
So what’s the problem with the strategy? It certainly looks appealing when we view it through this lens.
Here’s the thing…
As at November 2019 there are 314 possible positions within the S&P 500 universe.
Which ones to take? We know we can’t use hindsight to pick the best ones – the personality of individual stocks change over time.
To test the validity of the strategy itself, we need to rank the potential trades. For this simple exercise we’ll use the momentum of the stock over the last 50-days. When faced with more signals than cash available, we’ll take the highest ranked signal.
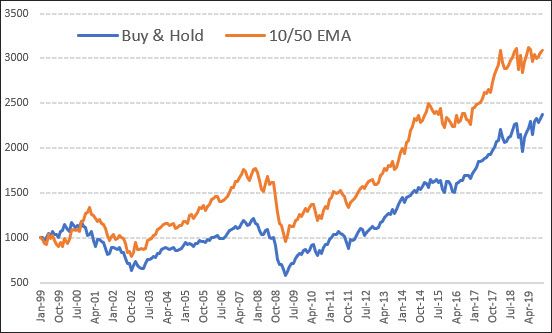
The portfolio will consist of 20 positions, each allocated 5% of equity. Commissions included. Here’s the equity growth chart…
The strategy shows a very slight out-performance compared to Buy & Hold. What’s not shown is the trade win rate that stands at 32% – extremely low and very difficult for most traders to cope with.
The drawdown during the 2008 crisis was still very steep at 48%. That may improve slightly with a regime filter.
In summary the 10/50 EMA crossover system is not overly compelling when used on a larger universe. Of course, if we could know what stock will be the best performer in the coming 20-years, we’d go all in.
But we can only know that with Hindsight Bias.
![]()