Trading and Hindsight Bias – Part 1
What is Hindsight Bias?
“Had you invested $1 in XYZ in 1943 it would now be worth $1.9 billion“.
I knew it was a good investment!
The problem is we actually didn’t know it all along, we only feel as though we did.
That’s hindsight bias.
Another typical example came across my desk recently. To quote the article, “ Apple is one of the top-performing stocks of the past 27 years with a +11,393% return but what if I told you there was a trend trading signal that doubled those returns to +25,896%? Would you be interested?”
The secret sauce?
“This trend trading strategy signals to go long when the 10 day EMA crosses and closes over the 50-day EMA and to go back to cash when the 10 day EMA crosses under and closes below the 50-day EMA.”
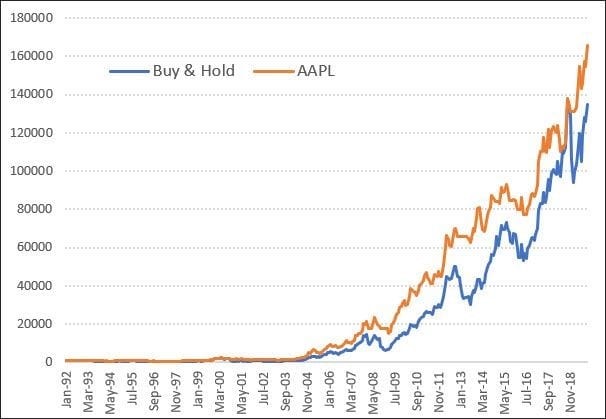
The following chart offers the equity growth of $1000 with all profits reinvested. I have used commissions, included stock splits and dividends.
Not quite the double performance as suggested but the strategy does outperform buy and hold. However, this article is about hindsight bias rather than performance metrics.
The obvious question is why use Apple as the example?
Back in 2000, while Apple was still in nappies, Sun Microsystems (JAVA) was Silicon Valley’s most prominent company and one of IT’s great innovators.
Applying the EMA crossover rules to JAVA leaves AAPL in the dust.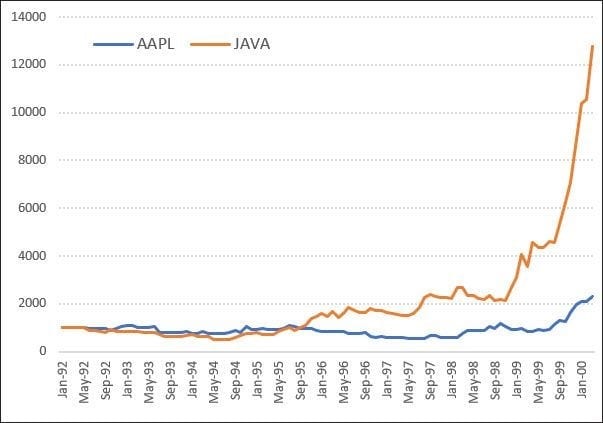
Anyone wanting to use a single market system would surely choose JAVA over AAPL? It was 6x more profitable.
With the benefit of hindsight, we see AAPL survived and thrived. JAVA on the other hand fell from $258 down to $2.60 before being snapped up by Oracle.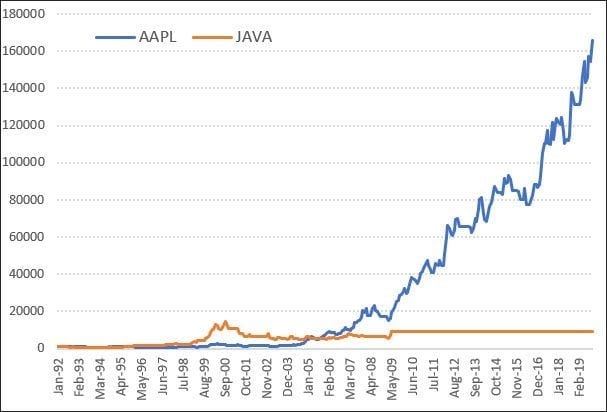
That’s hindsight bias.
So how do we know if AAPL will keep on keeping on? Or will it become the next JAVA?
Does the 10/50 EMA crossover strategy have broader merit as a strategy?
We’ll answer that in part-2.
![]()