
What are Mean Reversion Systems?
The following article is an excerpt from the Trading System Mentor Course.
Warren Buffett
Unbeknownst to most, the world’s greatest investor, Warren Buffett, is actually a mean reversion investor. He buys companies well below their respective ‘fair value’ then waits for them to return to that valuation or higher. He will tend to only sell a company if it’s price rises well above it’s value. Unfortunately two issues arise. Firstly, 99.5% of the population will not wait 10-years for a company to turn around and revert to its fair value. And secondly, he bases his decisions on pure fundamentals and copious amounts of discretionary input.
As technical systems traders we need to work around both of these.
As the name implies, mean reversion is the process of prices moving away from the respective average or mean price and then reverting back again, in some instances quite quickly.
Mean reversion is the opposite of momentum.
Momentum relies on the long tails that sustained trends provide and the goal is to ride those trends for as long as possible.
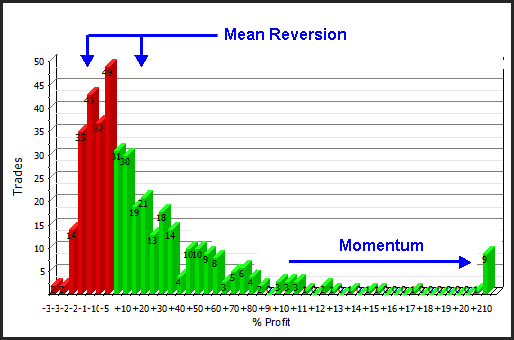
Mean reversion on the other hand relies on choppy random price action and preferably tight price tails so that price snaps back very quickly. If we review a trade distribution chart below, we can see where the two strategies generate their respective profits.
Mean reversion operates in the ‘noise’ where the majority of trades take place, whereas Momentum operates in the ‘outlier’ areas where not many trades occur.
Trend Following Strategy
In other words, where a trend following strategy fails, mean reversion systems can prosper, specifically in a noisy, choppy and trendless market.
There is significant evidence to suggest that markets trend just 30% of the time, and therefore are directionless the other 70%.
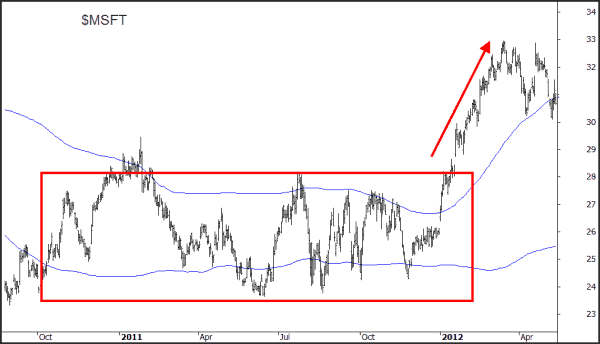
Even in a stock market, which tends to have a long term upside bias, price action tends to be quite random. Over the last 10-years 1338 (52.9%) days were up and 1187 (46.9%) were down. The following chart of Microsoft ($MSFT) shows typical stock price action – rotation back and forth for 12-months before trending for about 3-months.
Bollinger Bands
The blue lines shown in the chart above are Bollinger Bands which calculate the standard deviation around a mean price.
Price excursions beyond the bands tend to be reversed most of the time and they therefore lend themselves to being a good tool as a starting foundation. Another popular method of identifying reversal points is some type of overbought/oversold oscillator such as an Relative Strength Index (RSI).
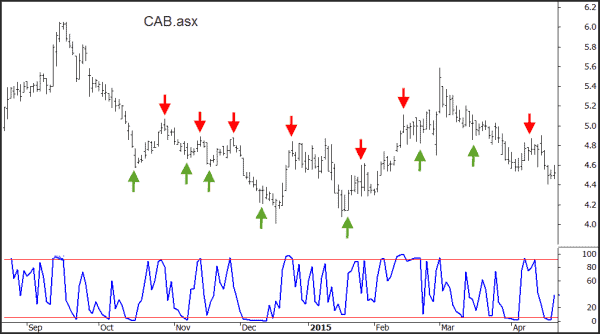
The chart below shows a very popular 2-day RSI used extensively by Larry Connors. In this example, the trades are very shorter in time frame. Rather than the above example which is looking for extended swings back and forth.
One could easily argue if mean reverting strategies operate better in 70% of market environments they are inherently better systems. On the surface that may appear to be the case. Most mean reversion strategies do operate with high win rates, circa 60% – 65%. Whereas trend systems operate at much lower win rates, circa 40% – 50%. Whilst a higher win rate may be more comfortable for the user. It doesn’t necessarily lead to a more profitable strategy.
The Trading System Mentor Course is now accepting new students. The recommended minimum starting capital is $100,000.
If you don’t feel like you are ready to take the step for the Trading System Mentor Course, then maybe our Beginners Guide to Building Trading Systems maybe for you.