
The 10-Month Timing Model
What is the 10-month timing model?
In late 2008, early 2009, I was approached by various financial planning firms and some stock brokers.
Their ‘buy and hold / can’t time the market’ business model was crashing and burning alongside global stock markets.
It’s a hard sell to tell a client to ‘stay the course’ when their portfolio of safe-as-houses property trusts with nice yields is 50% in the hole.
What they wanted was a strategy that was simple to implement, made market returns, without the large downside.
Possible?
We believed so.
The first thing that came to mind to meet the clients objectives was a simple timing tool on the broader market ETF.
When trading an ETF you can’t beat the market on the upside because you’re effectively invested in the market itself.
However, by using some type of timing tool you can remove yourself from sustained downward moves, such as we saw during 2008.
The two most cited examples are:
(1)
Jeremy Siegels’ 200-SMA timing tool on the Dow Jones Index (DJIA). His test bought the DJIA when it closed at least 1 percent above the 200-day moving average, and sold the DJIA and invested in Treasury bills when it closed at least 1 percent below the 200-day moving average. He concludes that market timing improves the absolute and risk-adjusted returns over buying and holding the DJIA.
(2)
Mabane Fabers Quantitative Approach to Tactical Asset Allocation which invests in five diversified asset class ETFs using a 10-month simple moving average (SMA). The timing model uses equal weightings and treats each asset class independently – it is either long the asset class or in cash with its 20% allocation of the funds.
For the purposes of today’s discussion we’re going to apply Fabers’ 10-month timing rule on the US S&P 500 ETF (SPY). The rules are simple:
Entry: If the close of the SPY > 10-month SMA, then buy the next open.
Exit: If the close of the SPY < 10-month SMA, then exit on next open.
We include commissions but exclude dividends and interest earned on cash holdings. Both of these would increase the shown returns. Data by Norgate Data back to 1995.
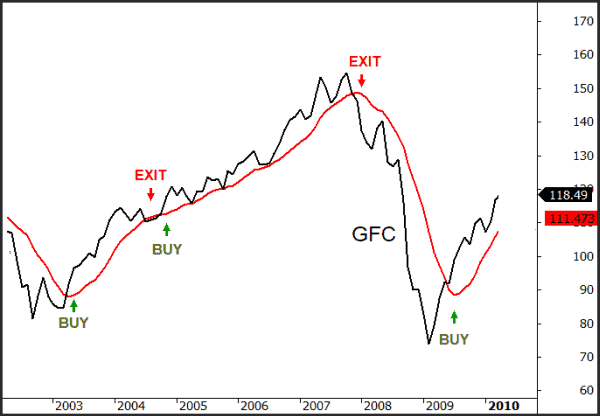
The chart below provides some insight of the signals lead up to and including the GFC.
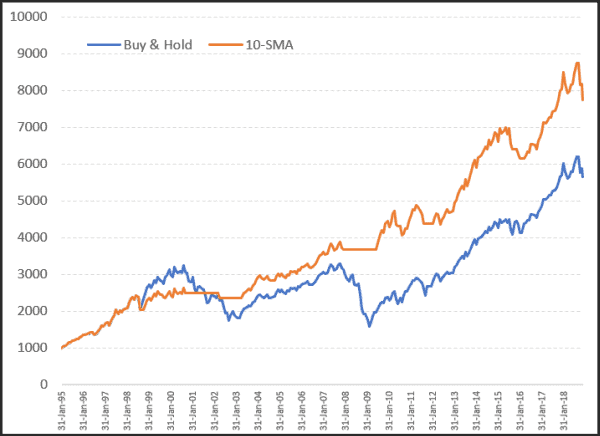
The next chart show the equity growth of the 10-month SMA system vs. Buy and Hold.The strategy has made 13 trades with an annual return is 8.91% vs 7.53%, a win rate of 70% and a win/loss ratio is 3.40.
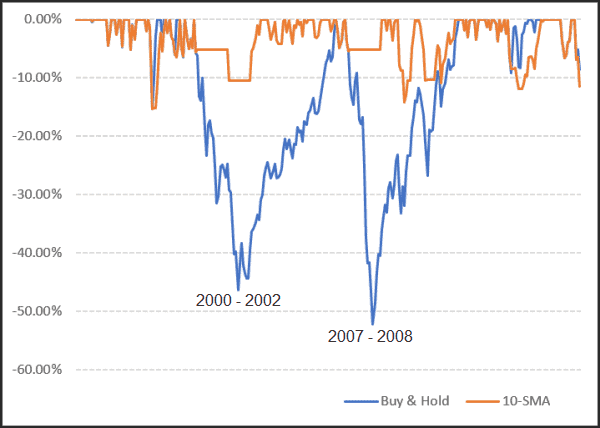
Lastly, and possibly the most important, the the underwater equity, or in laymans terms, the pain the strategy suffers. A buy and hold investor would need to weather equity declines exceeding 40% on two occasions. The 2008 decline was -52.5%. The 10-month SMA strategy however has suffered a maximum drawdown of -15.3%.
In summary, a low frequency strategy with minimal workload that provides a slightly better return than buy and hold, yet without the significant downside that a buy and hold investor needs to contend with.