
Analyst Coverage and Stock Trends
Analyst Coverage and Stock Trends by Nick Radge of The Chartist.
A phenomenon I noticed back in the late 90’s while trading futures, was that smaller stock index futures, such the Russell-2000, tended to trend much better than larger stock index futures, such as the S&P 500.
This got me thinking; perhaps more heavily institutionalised markets tended to be noisier and therefore not trend as well as their smaller counterparts.
There are probably many ways to define ‘heavily institutionalised’. Comparing total market values would be one. The US represents 59.9% of world equity market value, whereas Australia is just 1.9%
According to FactSet the S&P 500 currently has 10,708 ratings on stocks, which is an average of 21 per symbol. However, many big name companies dominate. Meta for example, has 63 analysts covering it. Amazon has 60, Google 53 and Apple 46.
Compare this to Australia where the largest company, BHP, has just 19. Commonwealth Bank has 15 and Amcor has 10.
Could more focus on a market or stock create more efficient pricing and therefore less trendiness?
To test this loose assumption, we’ll run several different systems across different time frames and compare various markets.
Our first test, below, will use an absolute trend following strategy on daily bars. An absolute trend system is one that looks solely at the trend of a stock on its own and without regard to the trends of other stocks. This strategy is the Growth Portfolio which I trade and have done so since the late 90’s.
We will use the same system and same parameters on each market, and yes, one could argue that some moderate tweaking could better tune the strategy to the different markets. But for this exercise, we’ll compare apples to apples.
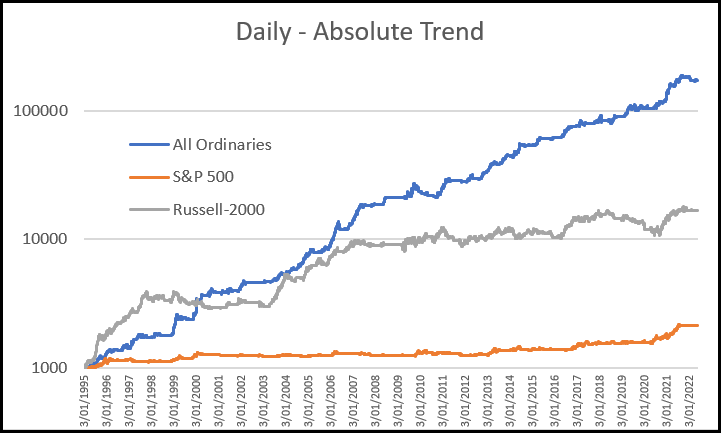
It’s clear that the strategy performs best on the lower cap Australian market, potentially the least efficient, moderately well on the small cap Russell-2000, also less efficient, and poorly on the more efficient and institutionalised S&P 500.
(Note – this is why I do not trade any absolute trend systems in the US market.)
Next, we’ll reduce the noise level a little by moving out to a weekly system, specifically the Weekend Trend Trader, that I also trade. This again is an absolute trend system and the same parameters have been used across all three markets.
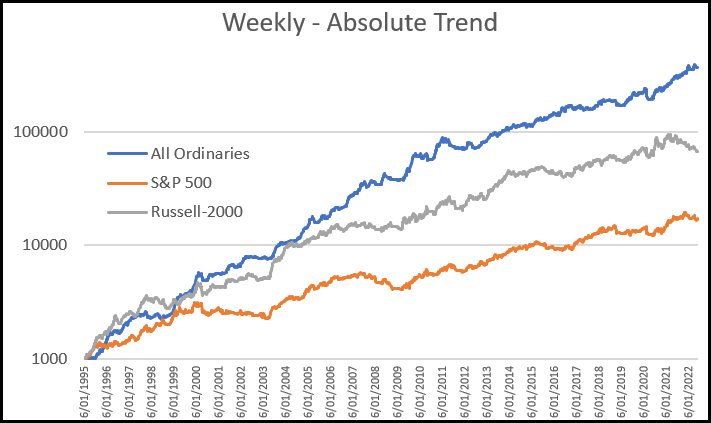
The lower cap markets still lead the way, but reducing the noise by going out to a weekly time frame has certainly helped the larger cap performance.
For the last exercise we’ll use a relative momentum strategy, specifically The Chartist’s US Momentum Strategy. A relative momentum strategy is a form of trend trading, but rather than look at a symbol on its own merits, we look at it in comparison to the trend in other symbols. This is a monthly strategy that in theory will reduce noise even more. It’s also another strategy that I trade.
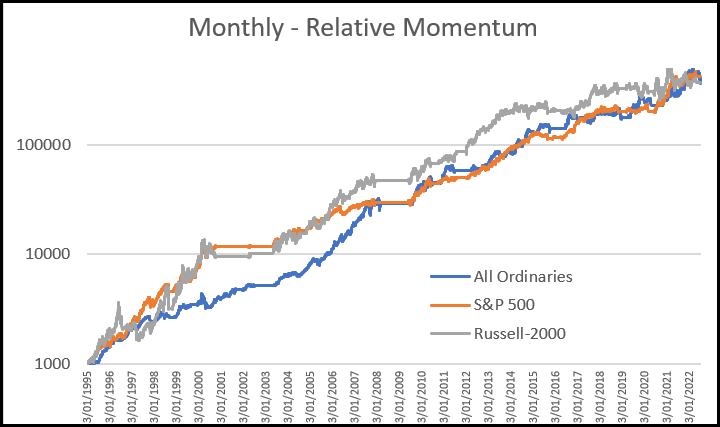
Several things are obvious with this last test. Firstly, moving out to a monthly timeframe removes much of the noise and allows broader trends to be caught. Second, it appears that this style of strategy, specifically a relative momentum strategy, is potentially more robust than an absolute trend following strategy.
One last observation. These various charts offer different equity growth trajectories, which is why diversification across strategies, markets and timeframes is an excellent way to grow your account.