
Short Term Swing Strategy
In the past I have discussed where to source trading ideas, namely HERE. Recently a short term mean reversion strategy came across my desk (interestingly it bears a striking resemblance to the short term systems I have discussed over the last 10-years. Go figure…)
This is a Stochastic strategy that appears on Trading With Rayner YouTube channel.
The rules of the strategy are:
Market: Russell 1000
Trend: Stock above the 200-moving average
Setup: 10-period Stochastic (K% smoothed at 1) below 5
Entry: 3% buy limit order below prior close
Exit: First higher close else 10 days.
There are a few other rules in the video that covers ranking and position sizing.
Below is the equity growth from 1995, which at first glance looks quite good for a simple strategy.
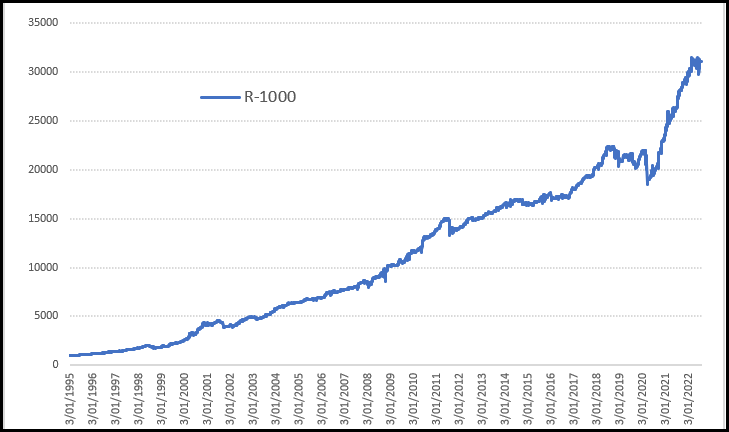
However, a key issue is that the strategy shown has only been tested on the current list of Russell-1000 stocks, that is, those stocks that have survived. For more accurate testing one should use the current and historical constituents, i.e. those stocks that were once in the Russell-1000 but aren’t anymore, as well as any delisted stocks. 10-years ago this data wasn’t available, but it is now and as such, should be a staple part of one’s testing regime.
So let’s put the strategy to the test using Norgate Data which allows us to use both the current, historical constituents and delisted.
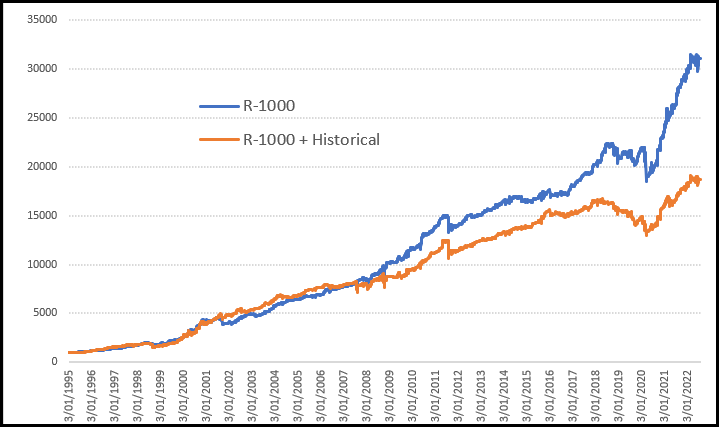
You can see there has been quite the degradation in performance from the original. However, the equity growth is still good and now we have a more accurate picture.
As a side note, if one was trading the full US market and not a specific universe, then historical constituents wouldn’t be needed.
Which leads us to the next phase of scrutiny. In many instances a strategy can be built for a specific universe. But to really prove robustness, it should stand up when tested on other universes. What we’ll do here is test the same strategy. But on the Russell-2000 universe which is a completely different set of stocks.
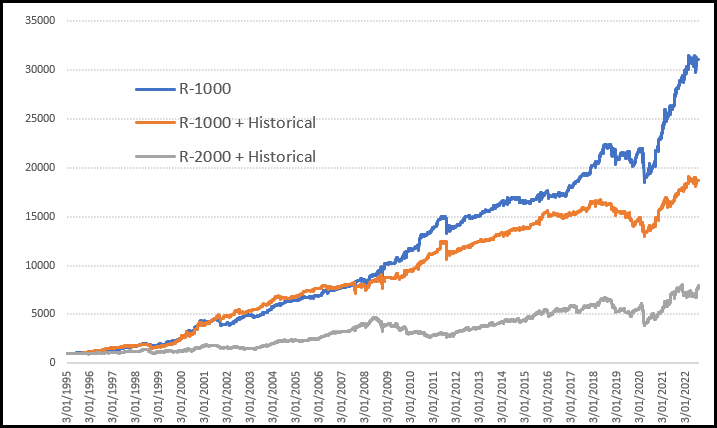
Quite a degradation in performance there which is a red flag for robustness. It could be that the added volatility of the smaller cap universe has impacted returns. Although there isn’t a significant increase in drawdowns.
With some creative thinking and a few small changes this strategy could be made considerably more appealing.
![]()