
Revisting My First Trading System
Let’s look at my first Trading System. We spin the clock back to 1985.
Trading fell in my lap one day. Randomly. One of those life changing events.
For some background take a listen HERE from the 24 minute mark.
The strategy wasn’t mine yet I could see trends and thus profits.
The rules?
Buy when the 5-day moving average crossed above the 10-day. Sell when the 5-day crossed back down through the 10-day.
That was it. No position sizing. No stop losses. Nothing.
I know, I shudder at the thought too.
I traded a single contract in the Share Price Index Futures from late 1985 through early 1987. Here are some stats that I have attempted to recreate from memory:
Total Return: +90.7%
CAGR: +53.8%
maxDD: -15.2%
# Trades: 36
Win%: 41%
W/L ratio: 2.6
Equity Curve
And here’s the equity curve for the period.
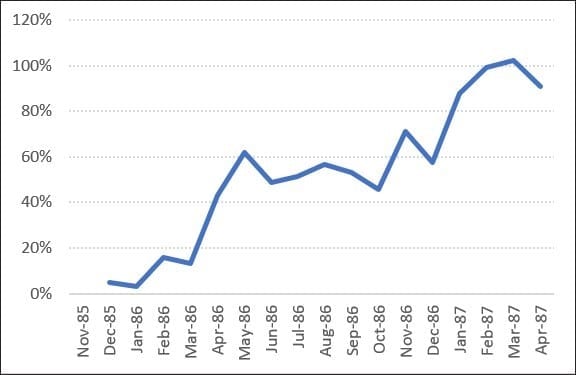
A 90% return in some 15-months.
No skill here. Pure luck. The old adage, “Don’t confuse brilliance with a bull market” comes to mind.
I ceased trading the strategy in early 1987, shown at “A” on the chart below. The reason is a story for another time, albeit driven by ego and greed.
Needless to say the strategy went short on September 28th 1987 and collected a 300% windfall on the Black Monday crash (shown at “B”). I wasn’t involved. Ironically, the strategy I changed to blew up and my father bailed me out.
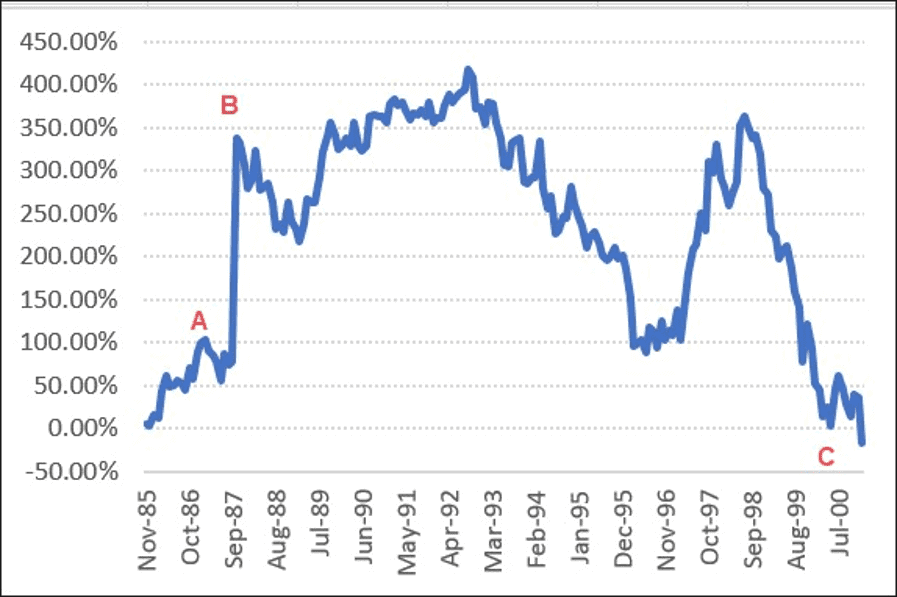
Over the next few years the strategy continued to make new highs before declining to terminal ruin in mid 2000 (shown at “C”).
Long term followers know I’m a big believer in understanding WHY a strategy makes money. Doing so enables us to gain more insight to understand how or why a strategy could fail.
Or in this case how terminal ruin came about.
Over the longer term the strategy showed standard trend following metrics; a win rate in the 40% – 45% range, and a win/loss ratio around 2.5 to 3.0.
So what went wrong?
Two attributes contributed to the rapid decline.
To start with the average loss was -13.7% of account value. Compare that to today where my average loss is -0.57%. Even the worst loss in recent memory for me is -1.98%.
That can work when the market is being kind as it seemed to do when I was trading the strategy. But if you trade long enough you’ll soon realise the market can get a little cranky at times.
Modeling
Modeling suggests a strategy with a win rate of 41% has a probability of 12 losing trades in a row.
Which is exactly what occurred between 1999 to 2000.
And when each loss represents nearly 14% of account value, the risk of ruin is 100%.
In summary, it was just a matter of time.
![]()