How To Create A High Winning Percentage Strategy
Last week we highlighted the Oops! pattern which appeared in Larry Williams’ popular book, ‘Long Term Secrets To Short Term Trading’. One of the reasons why the book was so popular is because many of the patterns and setups shown all had extremely high win rates, which is exactly what retail traders want, or think, is the key to success. However, as we showed, the use of data mining, which helps generate high win rates, tends to destabilise expected performance into the future. Another reason high win rates were achieved is via one of the exit mechanisms, which we’ll discuss today. Let’s highlight the exits used in the book (page 157):
- Always use a dollar stop.
- Use the ‘bailout’ profit taking technique. The basic premise is to exit on the first profitable open, even if that profit is 1c.
- Exit and reverse if you get an opposite signal.
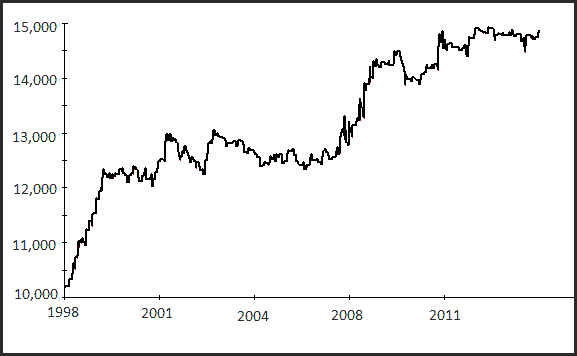
Let’s apply the strategy to something completely different, say Commonwealth Bank (CBA) shares. We’ll test back to 1998, using $10,000 per trade and the three stops above where the dollar stop will be set to $2,000 as per the book. Here is the equity growth:
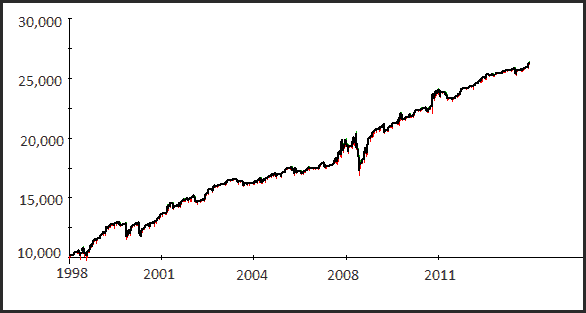
In this example the strategy made 354 trades with a win rate of 85.8% with net profit a little over $16,000. Impressive. Now let’s remove exit rule #3, so we’ll exit when either the hard $2,000 stop loss OR the ‘bailout’ exit is triggered. Here’s CBA again:
The net profit is now a little over $18,000 based on the sample of 284 trades, but the win rate has moved to an astounding 98.6% – just 4 losing trades out of 284. Remember, we’re not even applying a trend filter, rather, just taking any signal in any environment. Does the Oops! pattern have some magical edge or is it a slight of hand?
The answer lies within the ‘bailout’ exit. The next chart shows the usual or expected bailout exit at work. Note the length of each trade is just a day or so which could suck us into thinking that the Oops! pattern does have some kind of magical edge.
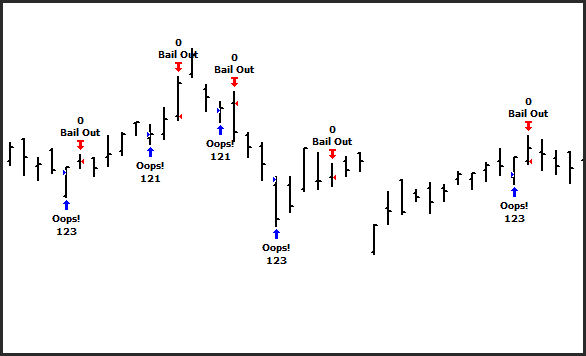
However, on closer inspection, every so often you get hit with one of these….
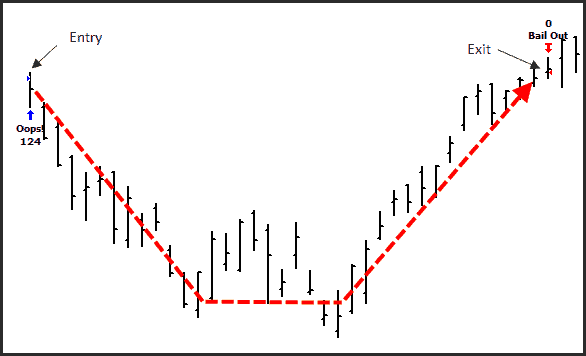
In this instance the hard dollar stop of $2,000 wasn’t triggered so the trade stayed active until that miniscule profit generated by the ‘bailout’ exit kicked in, almost 2 months after entry. Consider these two stats; whilst the win rate is 98.6%, the win/loss ratio is 0.05, meaning for every $1 you risk you make just $0.05 back. And whilst the chart outlining the ‘bailout’ exit above suggests profit gets taken quickly, the average losing trade is actually 59 days in length.
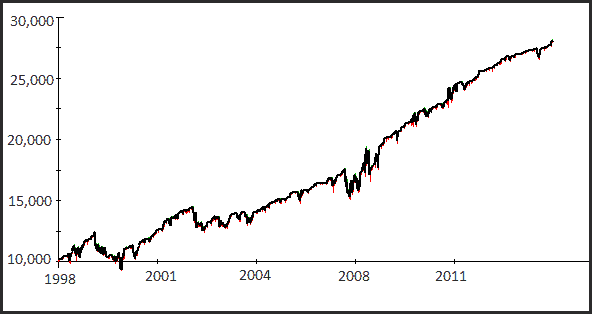
So is there really an edge with the Oops! pattern? To measure this we can exit the trade at the end of the days session and take a look at the stats. The net profit falls to $4,875, the win/loss increases to a more respectable 1.36, the number of trades increases to 437 and the win rate? 50.5% – basically random. The equity curve doesn’t look as exciting but the small edge from the reversal follow through, which is what author proposed in the book, keeps the equity growth moving over time. To properly validate the pattern we’d need to view it across a portfolio of shares – for another time.
To learn more about validating and testing patterns, consider our Beginners Guide to Trading Systems course.