
Trend Following on a Weekly Time Frame
Trend Following on a Weekly Time Frame
One of the most popular systems I wrote about in my 2012 book, Unholy Grails, was the Bollinger Band Breakout strategy.
That version used daily bars, but a common question I got was, “How does it perform on weekly data?”
Back then I coded up a weekly version to appease readers, so let’s revisit to see how it’s stood up over the last 7-years. We’ll call it the Weekly BBO.
In layman’s terms the rules are:
When the broader market is in an uptrend, look to buy any stock that breaches the upper side of its Bollinger Band. Place an initial stop 20% below and continue to trail that stop 20% behind as price moves higher. However, if the broader market trend turns down, then tighten that trailing stop to 10%. We will also exit if the stock closes below its lower Bollinger Band.
This strategy uses a slightly tweaked version of the classic Bollinger Band. The specifics are beyond the scope of this article, suffice to say it really won’t make a big difference to the bottom line.
Here’s how it looks on the chart. We get an entry at $2.19 in early 2012 then an exit in late 2018 at $5.19.
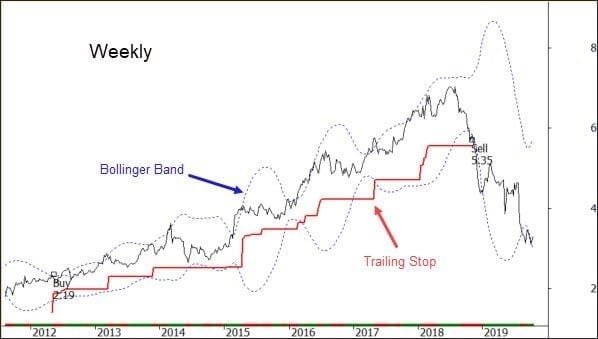
The adaptive trailing stop plays a crucial role.
My research suggests that market leaders tend to consolidate rather than decline during broader market selloffs. And when that selloff has completed, it’s those leaders that head the pack higher.
Giving the position some room to move allows those leaders to consolidate. In other words, I want to keep the “opportunity door” open a little, rather than slam it shut when the market turns down.
The specific rules for this trend strategy are:
1. Define the upward trend of the broader market (in this case the All Ordinaries Index) using a 10-week simple moving average. If the market is above that average, then it’s deemed to be bullish and we’ll take new positions. Below is bearish so no new positions.
- To the universe of stocks add a 40-week Bollinger Band calibrated to 3-standard deviations.
- Entry:If a stock closes above the upper band on a Friday, then buy the open on the following Monday. Do not take action during the week. Also note, I want the first close above the band only as the signal. There are times where the liquidity filter or the regime filter meets their criteria after the higher close. Ignore these.
- Exit 1:If the stock declines and closes for the week >=20% from the prior close, exit the position on the next weekly open.
- Exit 2:If the broader market trend turns down, i.e. the close of the XAO is below the 10-week simple moving average, then exit the position on the next weekly open if price has fallen >= 10% from its highest close. This is the adaptive stop loss at work.
- Exit 3: Exit the position if the weekly close is below the lower Bollinger Band. This rule rarely plays a part in the system.
Let’s now put the theory to the test using the following assumptions:
Universe: ASX All Ordinaries Index + historical constituents (2020 symbols).
Range: January 1999 – October 2019.
Comm’s: $6 or 0.08% which ever is higher.
Dividends: Included.
Interest: Excluded.
Liquidity: Volume > 500,000 average for last 5-days and cannot exceed 10% of days total volume.
Position: 20 positions of 5% account value.
Here’s the equity growth chart:
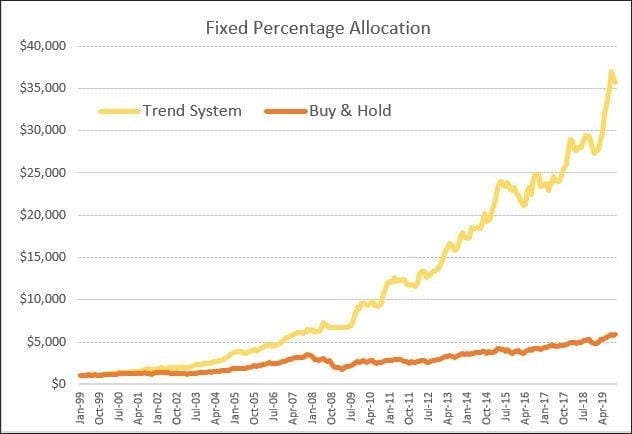
Performance capsule:
CAGR: 18.6% (Buy and hold = 8.8%)
MaxDD: -13.8%
# Trades: 661
Win%: 56.3%
W/L Ratio: 2.13
PFactor: 2.74
Win Months: 67.2%
Loss Years: 2 (2011, 2018)
The strategy has continued its strong performance on out-of-sample data over the last 7-years. Whilst one of those years posted a loss, four posted returns above 19%.
The low drawdown comes from two elements. Firstly, the regime filter of 10-weeks is very tight which enables the system to switch off quickly. Secondly, the adaptive stop also allows open profits to be protected when a market decline takes shape.
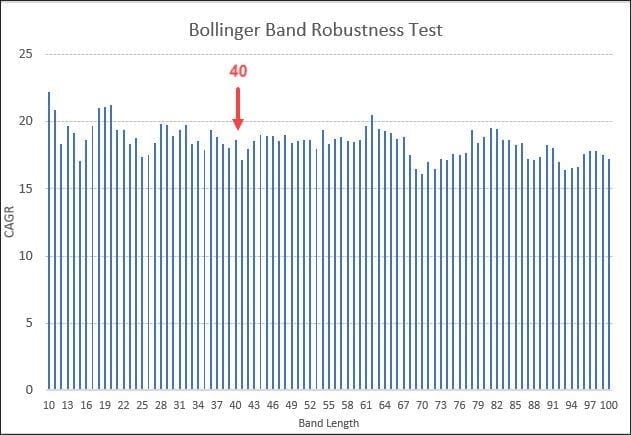
So why use 40-weeks for the Bollinger Band?
I have no idea where I got that from. Below is the return profile of every parameter between 10 weeks and 100 weeks that suggests the length of the lookback is negligible and it’s very robust.
Useful links relating to this article:
RealTest code is available to purchase HERE .
Trading System Mentor Course details available HERE.
![]()