
Is Trading Short Term In Australia Viable?
The strategy disclosed in our popular Earn A Second Income series was specifically designed to trade US equities, mainly because it offered a high level of trade frequency, which is an important element of profitability, and because US equities tend to have quite low commission rates.
The sign of a robust strategy is one that uses the same inputs to trade reasonably well across many instruments (we used the Russell 1000 constituents), but also one that can trade across different markets. And to that end one of the common questions we get is, “I’m interested in short term trading. Can I trade this strategy in Australia?” So let’s put it to the test on the ASX.
The strategy outlined is a mean reversion technique that looks to buy stronger stocks that are taking a short term dip, and whilst it trades both long and short, we’ll just use the long-only signals for this example. First, let’s review the system rules:
Long Entry
Close > 100-day moving average [ensure long term up trend is in place]
Close < 5-day moving average [ensure short term weakness is in place]
3 consecutive lower lows [sequential weakness confirmed]
Set a limit buy order for the next day if price falls another 0.5 x 10-day average true range.
Long Exit
If the close is greater than the prior close, then exit the position on the next day’s open.
For this test we’ll look at the ASX-300 using historical constituents to remove survivorship bias, 0.08% commission or minimum $6 whichever is higher and our position sizing will be 10% of equity allocated equally to 10 positions, so no leverage has been used.
The first chart shows the equity growth since 1995. Apart from a flat period during 2000 and minor wobble during the GFC, the account value rises steadily and without much volatility. The CAGR is 12.5% with a winning percentage of trades at 65.1%. Because of the smaller universe the trade frequency, and therefore the total return, are low, which is one reason why we prefer to trade it in the US. Since 1995 the strategy has traded 2818 times.

Interestingly this strategy doesn’t use an Index Filter. It’s not overly beneficial because of the initial entry rule, ensuring the stock is above its 100-day moving average, which acts as a quasi-trend filter anyway.
The next chart, commonly referred to as Underwater Equity, shows the frequency and depth of drawdowns since 1995. This strategy is low risk with a maximum drawdown of less than 8% – very comfortable for most traders and therefore opens itself to be used with some form of leverage.
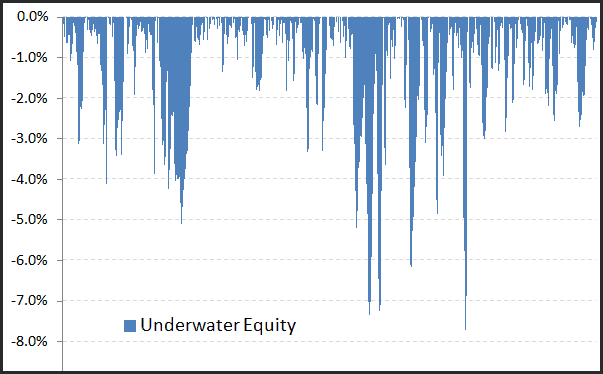
In summary the strategy has a strong MAR of over 1.0 (MAR = CAGR/maxDD), has proven it’s very robust by using the exact same parameters on both US stocks and ASX stocks, and can be scaled up with the use of leverage for those looking for a higher return profile.
Take a look at our Turnkey Code if you are interested in testing and running your own mean reversion strategy.
![]()