The Fast Lane Illusion
The other day I was stuck in traffic. The usual Friday afternoon rush hour coincided with a stadium concert and a broken-down ute, bringing Brisbane’s typically awful traffic to complete gridlock. As I sat there, averaging roughly two kilometres per hour, a silver sedan indicated to merge in front of me. I let him in, and we sat there for maybe 30 seconds before he merged again, moving two lanes to the right, then one to the left, then back to the right, changing lanes every time one seemed to be moving faster than his current lane.
And yet, as the traffic inched forward for the next 15 minutes, it never once left my sight. Sometimes he got further ahead; sometimes he was right back beside me again. But ultimately, when it came time for me to take my exit from the highway, he was further back in traffic than me. Watching him constantly change lanes reminded me of something we see investors do every year.
I get it. Traffic is frustrating, especially when you urgently need to be somewhere, and any given lane you’re in always seems to be moving the slowest. How is it that the cars in the lanes on either side of you are always overtaking you and yet never getting any further ahead?
But you didn’t sign up to this newsletter to hear me talk about traffic, did you?
Last year, the Trade Long Term portfolio was our lowest-returning US portfolio, rising +2.2%. It’s an aggressive momentum strategy that relies on big runaway movements, but last year, it did not catch any. Despite that quieter year, Trade Long Term still maintains the highest live 10-year CAGR of any of our US portfolios at +21.5%.
On the other hand, our US High Frequency strategy outperformed for 2025, returning +25.7%. So, what would’ve happened then if at the end of 2025 you judged Trade Long Term as underperforming and moved your money to the US High Frequency instead?
Well, as it currently stands year-to-date, Trade Long Term has returned +19.94%, while the US High Frequency has returned +3.4%. There are two important lessons here.
Firstly, short-term performance statistics can easily mislead. Just like when you’re stuck in gridlock traffic and the lane next to you is moving faster than yours at that moment, it does not mean that the other lane’s speed will continue to be faster. The average speed of that lane over time would give you a much better idea of whether the decision to move is wise. Similarly, a longer-term CAGR is a much better indicator of a strategy’s performance potential than a short-time performance metric is.
Secondly, if you do move from one trading portfolio to another and the short-term performance does not immediately match the long-term performance, ask yourself, “Realistically, is there something wrong with the lane I’m in, or is there just a temporary slowdown in the traffic?” Sure, if there’s a broken-down car ahead in your lane or if you need to make your exit soon, then by all means move across, but if you’re moving across to get a small speed boost, you’re likely to be disappointed.
I think we’re done with that metaphor now.
In trading, there are a few reasons why frequent strategy hopping leads to diminished returns. Often, traders will exit at a low point of their current strategy and move across to a high point of the new strategy. By doing this, they may be effectively cashing out at a bottom and then investing at a top. This is the reactionary rookie trader 101. Sitting through temporary underperformance is uncomfortable, but abandoning a solid strategy is usually far more costly.
Strategy hopping also creates a mathematical disadvantage due to the compounding mechanisms many strategies rely on. As I mentioned with the Trade Long Term earlier, it relies on long, extended, runaway movements to significantly boost its performance (more on that here). Jumping between portfolios undercuts this mechanism, however, as demonstrated below.
Imagine Investor A is invested in a strategy that buys XYZ stock at $25 a share. Over the next month, the value of this share doubles, and it is now worth $50. Seeing this performance, Investor B moves away from their current strategy, buying share XYZ at $50.
Over the next year, the share price continues to rise to $75. Investor A, who bought at $25, has thus seen a 200% profit on their initial investment. Meanwhile, the strategy-hopping Investor B has received a 50% increase in their initial investment.
Same portfolio, same stock, slight time difference, dramatically different results.
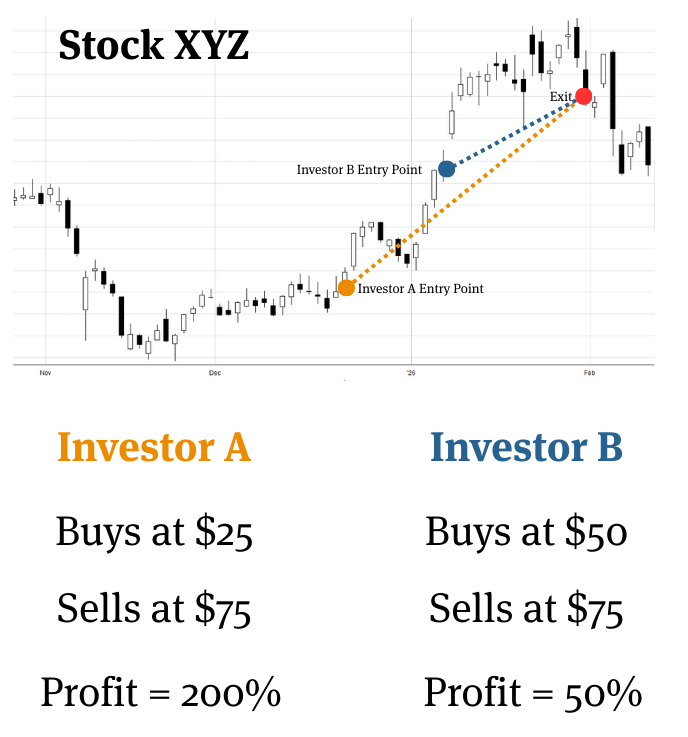
While a 50% profit is certainly impressive, this example demonstrates how frequently altering a strategy based solely on short-term performance can significantly harm long-term performance.
In markets, just as in traffic, constant switching rarely gets you there faster, it just makes the journey more frustrating.