
Stock Splits – Part 2
In our last article we discussed stock splits.
When testing trading systems, the first step is to use an accurate data source. In the computer science world the term, ‘Garbage in, garbage out’ is used for good reason. Computers make calculations using logical processes. A computer will therefore process unintended, even nonsensical, data – known as ‘garbage in’. If this input data is erroneous then the output will also be erroneous – ‘garbage out’. We tend to blindly accept and trust easily accessible data, especially if it’s free.
Yet corporate actions, such as stock splits, will have some impact on price data series and in turn, will be reflected in a strategy back test. Good quality data should have all official dilution factors and corporate actions applied to the database automatically which will then make the back test a much more accurate representation of real life trading.
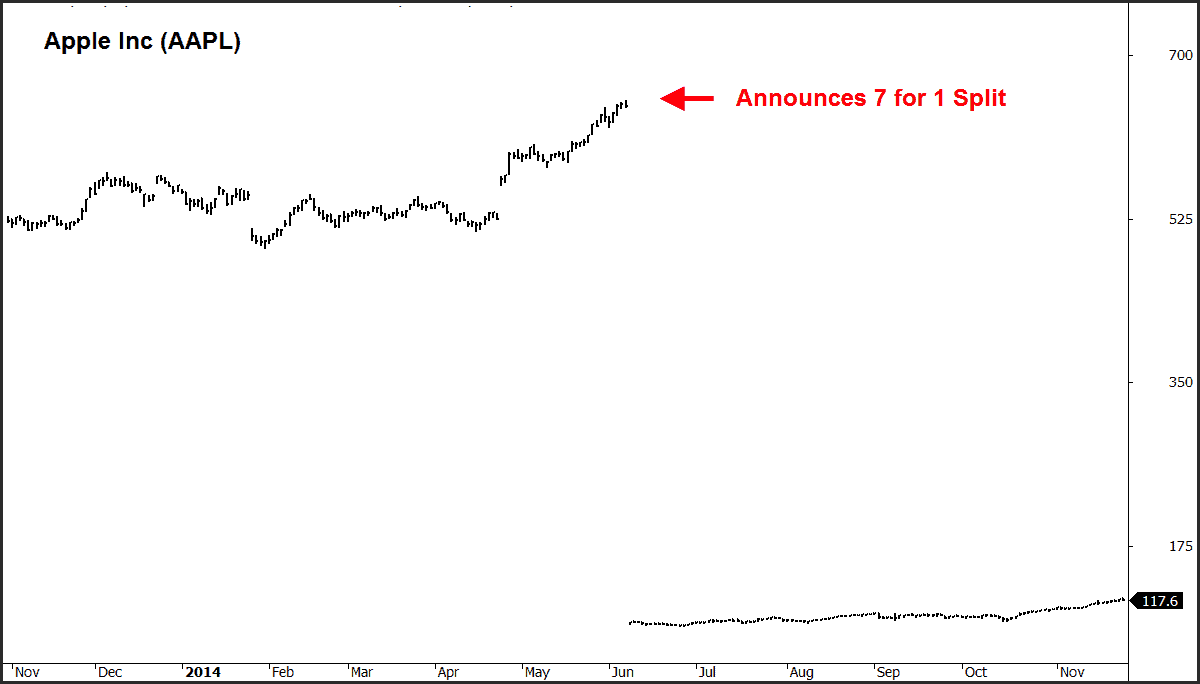
Apple Inc (AAPL)
The following chart of Apple Inc (AAPL) shows a typical share split and how it impacts on a non-adjusted price chart. In this case AAPL split 7-for-1 which means that for every share you hold you will receive 7 new shares. As a result the share price is diluted by a factor of 7. Testing a trading strategy on this non-adjusted data will show a significant loss, when in actual fact no such loss occurred. The share price dropped by a factor of 7, but you now own that many more shares.
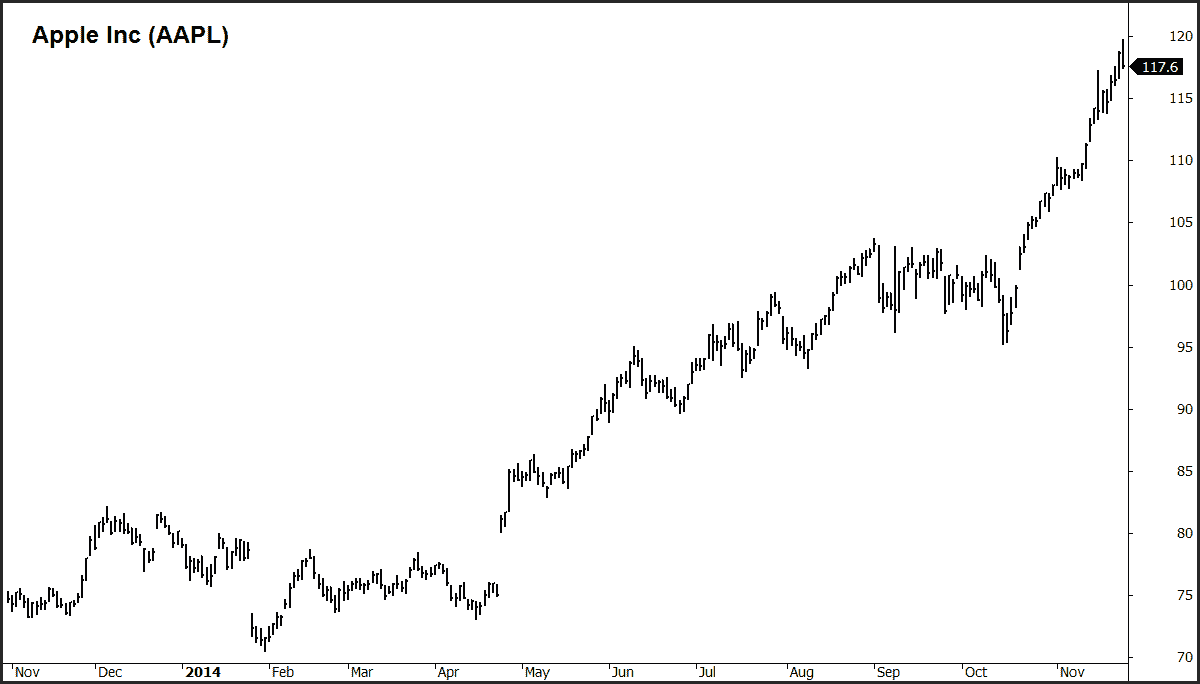
Here is what correct split-adjusted data should look like.
In Australia where we have some 2000 listed securities, there are some 300 actions per year. In the US, with over 9000 listed securities, the required database maintenance is even more extreme.
If your data vendor doesn’t provide effective database maintenance, you will:
→ have a lot of useless data,
→ have data that is cumbersome to handle,
→ difficulty navigating universes and, more importantly,
→ create erroneous backtest results.
We use and recommend Norgate Data.
![]()