Pyramiding: Adding to an Existing Trading Position
Preface: This article on pyramiding has been designed and optimized for the The Chartist’s Growth Portfolio. The principles contained herein are effective for any trend following strategy of any time frame, but all references will be directly related to the The Chartist’s Growth Portfolio.
The term ‘pyramiding’ refers to the adding of positions to an existing holding as the share price moves in the direction of the current trend. For pyramiding in bullish market environments this means adding positions as the price continue to rise. It does not refer to adding to positions as price falls. Adding to losing positions is a quick way to the poor house. The simple concept of trend following is to buy strength; buy high and sell higher. The key benefit of pyramiding is that a clean and sustainable trend will allow excessive gains to be made with minimal additional risk taken. It could be argued that one single clean and sustainable trend can double or even triple a non-pyramided account return in any given year. Obviously there are downsides as well that we will discuss later in more depth.
The goal of this article is to give you a solid working plan to help enable an effective pyramiding strategy should you wish to pursue it. Pyramiding does require a little extra work, extra commissions, a little extra frustration, extra risk, but over the longer term it should provide substantially bigger gains.
The most important element of correct pyramiding is to increase position exposure whilst at the same time keeping ‘manageable’ risks under control. ‘Manageable’ risks are the ones that we can directly control as opposed to those other nasties called ‘price shock’ risks which we’ll discuss shortly.
For this discussion we’ll define risk in terms of ‘units’. One unit of risk, known as 1R, is the distance between the entry price and the protective stop price.
Consider the following chart:
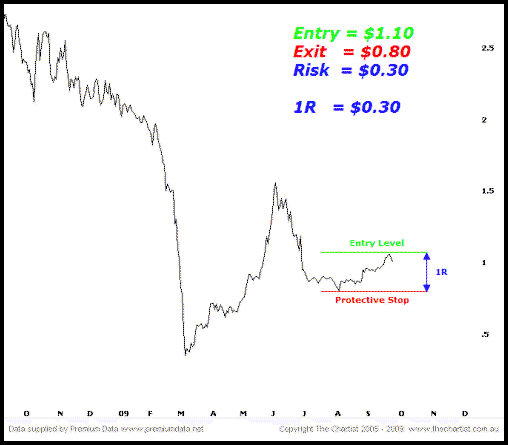
Let’s assume our system dictates that the entry is $1.10 and the protective stop is placed at $0.80. The risk is $0.30 ($1.10 – $0.80), therefore 1R = $0.30. From now on all concurrent trades, pyramids and stops, will be based on this initial R calculation. After entry is achieved at $1.10 we need to add or pyramid the position, although it’s best to calculate the ongoing levels prior in case a swift upside move follows. When dealing with a shorter term trend system one can pyramid all positions in a single session. However, with the Growth Portfolio, that allows some room to move, it’s rare that two positions will occur during the same session.
The first pyramid level is Entry + 1/2R, remember that R = $0.30, so 1/2R = $0.15.
Therefore, $1.10 + $0.15 = $1.25

If we get filled on Pyramid #1 we then need to move the initial stop up so as to keep risk aligned as much as possible. The stop should be moved up from its initial position by 1/2R as well.
Therefore,
| Position | Entry | Protective Stop | Risk |
| Initial Entry | $1.10 | $0.80 | $0.30 |
| Pyramid #1 | $1.25 | $0.95 | $0.45 |
It’s at this point that our risk does increase, albeit at a lower rate than our exposure. You can see in the table above that our position size has now doubled, yet risk has only increased by 50%. This is a trade off we must take in order to make the outsized gains we’re after.
The next thing to note is that at each pyramid level we buy the same amount of shares as the initial allocation. If you feel the extra risk is not for you, then buy a smaller parcel. It’s more important that the stop is kept away from the current action rather than tightened up to lower risk. In order to lower risk, buy fewer shares instead.
We have not finished yet. We can add three pyramid levels for a total position that is 4x the original, yet risk will always be retained at the 1.5R amount.
| Position | Entry | Protective Stop | Risk |
| Initial Entry | $1.10 | $0.80 | $0.30 (1R) |
| Pyramid #1 | $1.25 | $0.95 | $0.45 (1.5R) |
| Pyramid #2 | $1.40 | $1.10 | $0.45 (1.5R) |
| Pyramid #3 | $1.55 | $1.25 | $0.45 (1.5R) |
Once Pyramid #3 is in place we allow the underlying system rules to play catch-up. Because we have manually overridden the trailing stop of the system, there is s chance that we could be stopped out prematurely. Again, this is a trade off we must make.
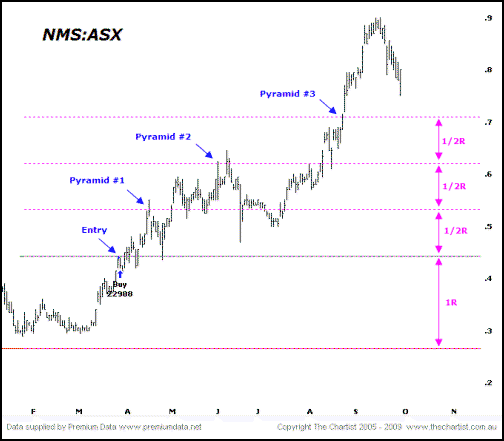
Consider the following chart of NMS:
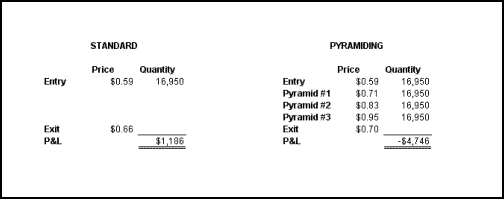
The following table shows a rapid increase in P&L when pyramiding is successful:
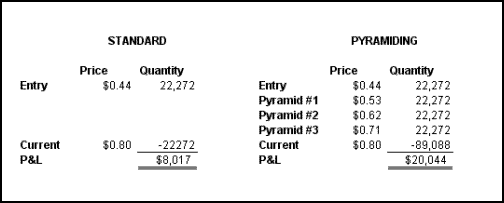
It’s important not to keep pyramiding. The trend has, in theory, a finite length. The more you add to positions the higher the chances of pyramiding into the end of the trend or creating such a large position the exposure becomes extreme.
The above table highlights one negative issue when pyramiding – it’s capital intensive. The amount of extra profit generated has taken substantially more capital, although if the trend continues unabated then this will become a much better equation. However, the extra capital will limit the amount of trades one can take and in turn limit the amount of diversification of positions. One of the key elements of the Growth Portfolio’s success is capturing outlying trends. The more positions one has the more chances of capturing the big trend.
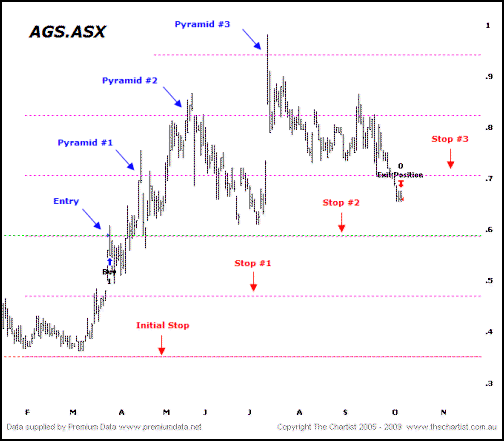
A secondary issue is that we must override the system in order to keep risk aligned as much as possible. The above chart shows another position that was closed out at a small 10% profit. However, when we add in the pyramiding we actually finish with a loss.
Let’s walk through the stop loss amendments first. Remember each time we add a new pyramid we must move the stop up by 1/2R.
The system enters at $0.59 with an initial stop at $0.35. Therefore, 1R = $0.24 so 1/2R is $0.12. We add the first pyramid at $0.71 and move the stop to $0.47. We add the second pyramid at $0.83 and move the stop to $0.59. At this point the stock drops back considerably but does not trigger the stop. It then rallies hard and triggers pyramid #3 at $0.95 meaning we then move the stop up to $0.71. The average entry level is now $0.77.
Our stop loss is hit at $0.71 but we get filled at $0.70. The system proper exits a few days later at $0.66.
A third issue with pyramiding comes out of the woodwork when some kind of price shock event occurs. A lot of times we view a price shock as an adverse price movement against us being part of a broader market movement. The 1987 crash and Sept 11 were two price shock events that couldn’t really be dealt with from a trade management perspective. 2008 was devastating but its not really a price shock as positions could have been successfully managed before account destruction took place.
But a recent left field anomaly that can do damage is the current ‘trend’ for capital raisings via rights issues. Some of these have been at deep discounts to current market prices and come without warning. Depending on the institutional take up and the ‘hang over’ of stock depends on what kind of damage will be inflicted. Capital raising tends to have a harder impact and shorter term trading rather than longer term trend following, but its still a damaging hindrance when one is ‘fully loaded’ after pyramiding.
![]()
IMPORTANT INFORMATION: This article may contain advice that has been prepared by Reef Capital Coaching ABN 24 092 309 978 (“RCC”). Any such advice is considered general advice and does not take account of your objectives, financial situation or needs. Before acting on this general advice you should therefore consider the appropriateness of the advice having regard to your situation. We recommend you obtain financial, legal and taxation advice before making any financial investment decision. Past performance is not a reliable indication of future performance. This material has been prepared based on information believed to be accurate at the time of publication. Subsequent changes in circumstances may occur at any time and may impact the accuracy of the information.