Portfolio Management Software for The Chartist
Portfolio management software – Share Trade Tracker
Share Trade Tracker is only available to paid members of The Chartist (not available with the free trial). It is no longer sold as a standalone product. You can join The Chartist here or members can request access to Share Trade Tracker here (you must use the email address linked to your membership).
Links Nick mentions in the video:
Norgate Data – Nick uses Norgate data as it is reliable and clean. (This is an affiliate link)
Amibroker trading software
Speedy Trading Servers – VPS
TWS – Interactive Brokers Trader Workstation
Video Transcript
I thought I’d do a quick video today on my daily workflow with specific reference to trade reconciliations and also performance reporting. Obviously trading eight different portfolios, there’s a bit of paperwork involved. It actually doesn’t take that long, maybe five to 10 minutes each day, and I’ll show you how I actually do that. The workflow basically is I have my AmiBroker sitting on a local computer, not sitting on VPS simply because I want one set of files. I want them to be able to be backed up easily.
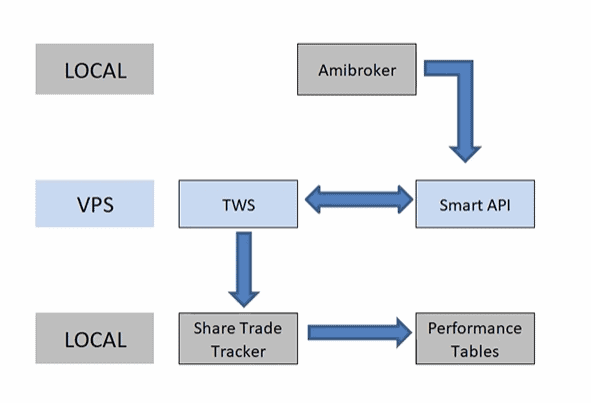
I don’t want two sets of files. That’s for sure. Because if I make an adjustment in one, I’d have to make sure I made it in the other. And that’s just a cause for concern. So one set of files only. Apart from its usual workload, AmiBroker in this context on a day-to-day basis, the way it works is I simply input my account balance, and then it does two things. It does the position sizing automatically for me, and it also pushes through the actual orders. Those orders get uploaded into our SmartAPI.
We have a new one out now called SmartAPI version two, which has some pretty funky functionality. And the API sits on a VPS. I use Speedy Trading Servers. It’s dedicated solely to traders. It is a little bit more expensive, but it has 100% uptime, which is absolutely important for me specifically because trading the U.S. market I’m asleep and I don’t want any downtime on my VPS. On the VPS, I have the SmartAPI and I have TWS sitting there, and they talk to each other and manage the trades.
Trade Reconciliation
With regard to trade reconciliation, from TWS, I can export the trades two ways. I can literally cut and paste from the SmartAPI, or I can actually export them out of TWS, and they both go into Share Trade Tracker. Now, Share Trade Tracker was a commercial product. It is not anymore. Clients of The Chartist can get it complimentary, and we basically manage that software from now on. We’ll go and have a look at that shortly. Share Trade Tracker enables you to manage as many portfolios as you want.
What I mainly use it for, even though I’ve got about four or five different trading accounts, some of those accounts run multiple strategies. For example, in Interactive Brokers, I have one account that has four or five different strategies. Rather than try and reconcile the dollars and cents in that account specific, I actually do it in Share Trade Tracker very easily, and from there, I take one extra step.
Performance Tables
I actually then put the data into some CFTC regulator performance tables that just gives me a much better idea of where I stand on a month to month basis, in a year to year basis. So let’s take a look at Share Trade Tracker. As I said, this was available commercially. It’s not anymore. It is available for clients of The Chartist, and it’s complimentary. You can have as many portfolios in here as you like. I’ve just put in some dummy portfolios of mine. Well, they’re not dummy, they real portfolios, but dummy data.
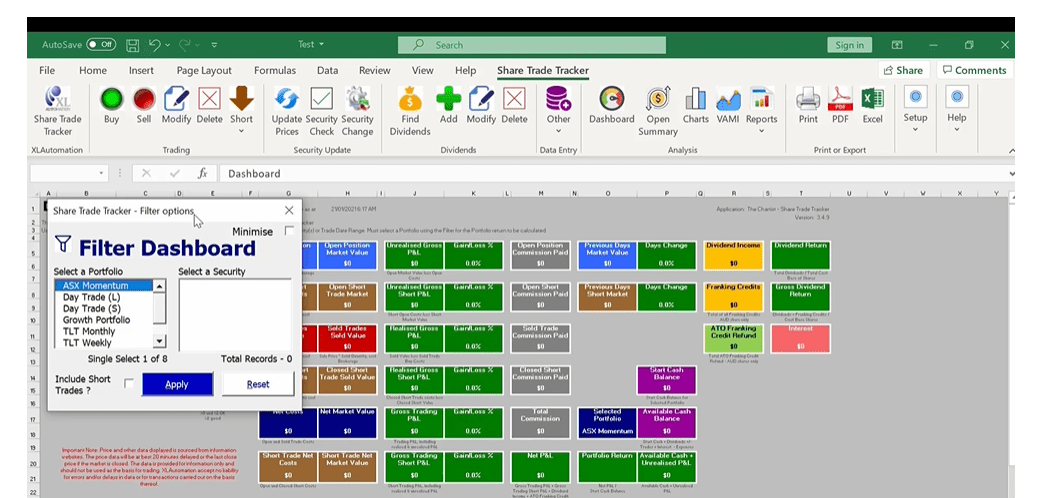
We can see a summary sheet here at the front and you can see lots and lots of different metrics. This Share Trade Tracker is actually connected to Norgate Data. As a result, I can pull closing prices and dividends, out of Norgate Data, which is accurate data. You can connect it to, I think, Google or Yahoo data as well for free, if you like. Little buttons up here, we can update prices, get the dividends, change trades, add, subtract funds.
We can do all sorts of different things, creates all sorts of different reports, everything that one would need to manage portfolios. But as I said, the benefits of me is I can manage multiple portfolio in a single account and do it through here. So in terms of uploading trades, very simply, we click on the upload button. There’s two ways you can upload directly from Interactive Brokers, or the other way to do it is through something like SmartAPI.
SmartAPI
SmartAPI version two, it actually generates a trade report, literally copy paste into here, and it will populate all the data. And then we can go through each individual portfolio and have a look. For example, if I was to choose day trade short, you can see I keep day trade long and day trade short as separate portfolios in here simply so I can monitor them on a individual basis. And basically what I’m doing is I will just take the net P and L for that particular portfolio, then I’m going to move it across on a monthly basis into the CFTC portfolio spreadsheets.
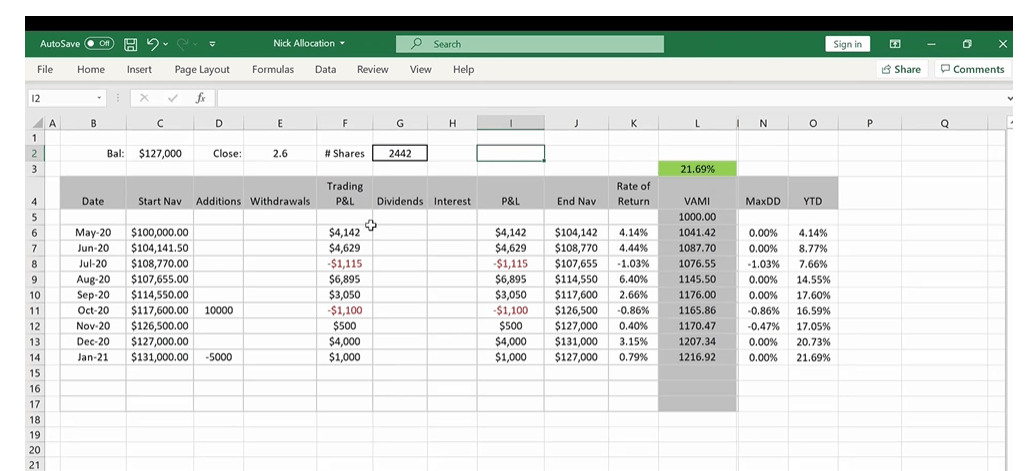
So here’s an example one, and all I’m actually populating is the trading P and L on a month to month basis. This one takes into account additions, withdrawals, so on and so forth, and then it’s giving me an ending nev balance and also my rate of return for the month, valuated monthly index. It also calculates my maximum drawdown and year to date return. The other thing I do use this for on those less active portfolios, such as the ASX Momentum, I am able to do some position sizing up here. So let’s say for example, I’ve got to buy a stock for $5.
Just plug it in there. It’s referencing the current ending nev balance, and it’ll calculate how many shares. I only do that for the less active portfolios. As I said before, the active portfolios, I actually use AmiBroker to do all that, but I will take the balance out of here and put it into AmiBroker. That’s basically the way it works. A combination of Share Trade Tracker that does all the intense metrics, and then I’m using this particular spreadsheet.
Portfolio Tabs
You can see down the bottom here that I’ve got all my different portfolios in a separate tab, so we can trend trade, so on and so forth. They all sit in their own separate tabs. I get a very good understanding of where I stand on any particular day or week or month with regard to performance. That’s basically the way I do it. It’s pretty easy. Share Trade Tracker, I can generate the various reports there to send to my account. And if we just bring that up again, where are we?
We’ve got reports, all sorts of different reports that we can generate here, print them out, put them into PDF, put them into Excel, and send them off to the accountant. It’s all very efficient, lots of metrics, probably more metrics there than anyone needs. You can also do different kinds of charts, equity charts and VAMI charts, so on and so forth. That’s a bit of background of how I do it.
It really doesn’t take me long each day, five to 10 minutes, and we’re done and dusted and got good accurate reports that I can then monitor, especially the performance metrics showing here in Share Trade Tracker.
![]()