
Pattern Recognition: Moving Average Breakout
Pattern: Moving Average Breakout
One of the first technical analysis indicators beginners are taught is the basic moving average crossover system. In nicely trending markets this method works extremely well. However, markets only trend about 25% of the time. It’s the other 75% that a normal moving average crossover will cause your account to bleed to death.
Whipsaw is where a system repeatedly buys and sells for small losses. Long periods of whipsaw are common and it’s during these non-trending times that many small losses are accumulated and for the novice trader, frustration will build.
To decrease whipsaw we use filters. A filter is simply an added criterion that has to be met before the trade or setup can be taken.
The Setup
Firstly we need to trade in the direction of the trend. We define the trend using a single moving average. For our purpose we’ll use a 20-day simple moving average.
Varying the lengths will determine the length of the trend you will catch. A longer moving average will enable longer-term trends to be ridden, but the payoff is that a lot of unrealised profit will be left on the table. A shorter moving average will decrease the profits left on the table, but will increase the whipsaw.
Conventional moving average crossover highlighting a period of whipsaw:
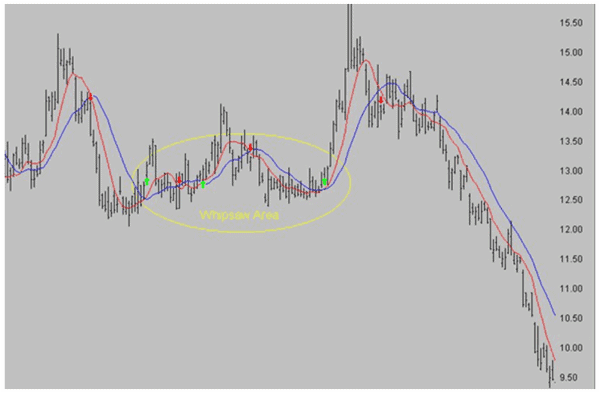
Unlike conventional moving average crossover systems, we only require a single moving average (in this case a 20-day). The signals are given as prices move through the moving average, as opposed to crossing over another moving average.
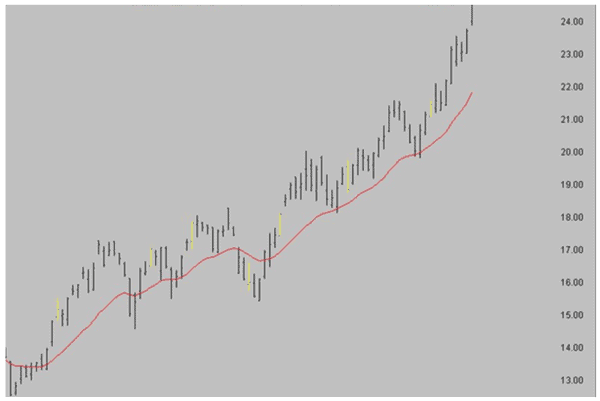
To alleviate whipsaw we will add two simple filters. The first filter is a rule that requires prices to stay above or below the moving average for 2 straight days.
In an uptrend, prices must move up through the moving average and post 2 lows above the average.
In a downtrend, prices must move down through the moving average and post 2 highs below the average.
These can be seen in the following chart by the bars coloured in yellow. Notice that each yellow bar has been above or below the average for 2 days.
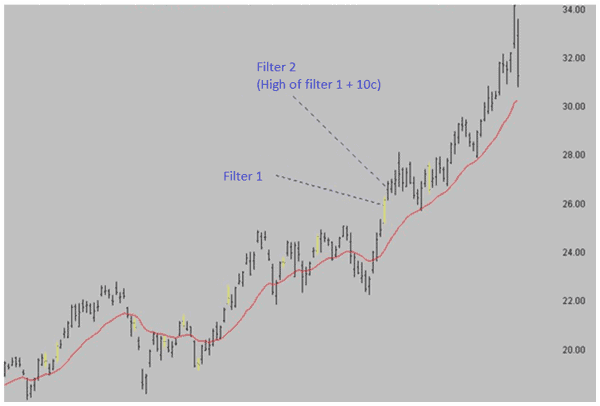
The second filter is also required before the trade can be taken. This filter is a break of the highest bar of the two bars that have moved through the moving average.
So, in an uptrend we need prices to move up through the moving average and then post two lows above the average (filter 1). We then need the highest high of those two days to be breached by ‘n’ cents (filter 2). For the purpose of this text, ‘n’ will equal 10 cents.
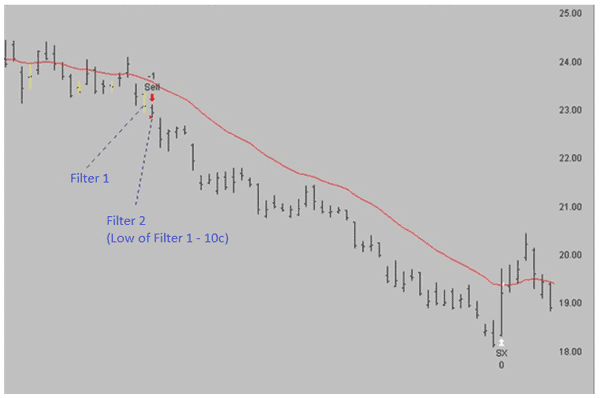
In a downtrend, the reverse is true. The price must decline down through the average and then have two highs that remain below the average (filter 1). Filter 2 requires that the lowest low of those two days must be breached by (e.g.) 10 cents.
Review the following chart. Notice that the yellow bar is the second bar through the average, either up or down. This is the first filter. Then, the yellow bar must be breached by 10 cents for the setup to be completed.
The Entry
The point where filter 2 occurs is also the entry point.
In an uptrend, we would wait for the market to move up through the average and post two lows above that average. Then, taking the highest high of the two days, we add on 10 cents to complete the second filter. This is where we place the order to buy on stop. If the market breaks the highest high of the two days and then exceeds our secondary 10-cent boundary, we enter the trade long.
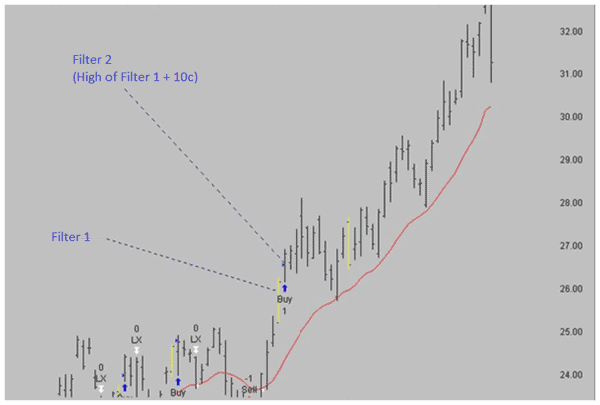
The opposite is true for a downtrend. Wait for the prices to move below the average and have two highs that are below that average. Then, taking the lowest low of those two days, subtract 10 cents, which would complete the second filter. This is where we place an order to sell on stop. If the market breaks the lowest low of the two filter days and then exceeds our 10-cent boundary, we would automatically be entered short into the trade.
More information on Moving Average Breakouts including where to place stops and how to manage the trades is available in Building a Profitable Trading Plan Using Technical Analysis course provided to members of The Chartist within the Education section.
![]()
In our next article we’ll discuss the Channel Breakout